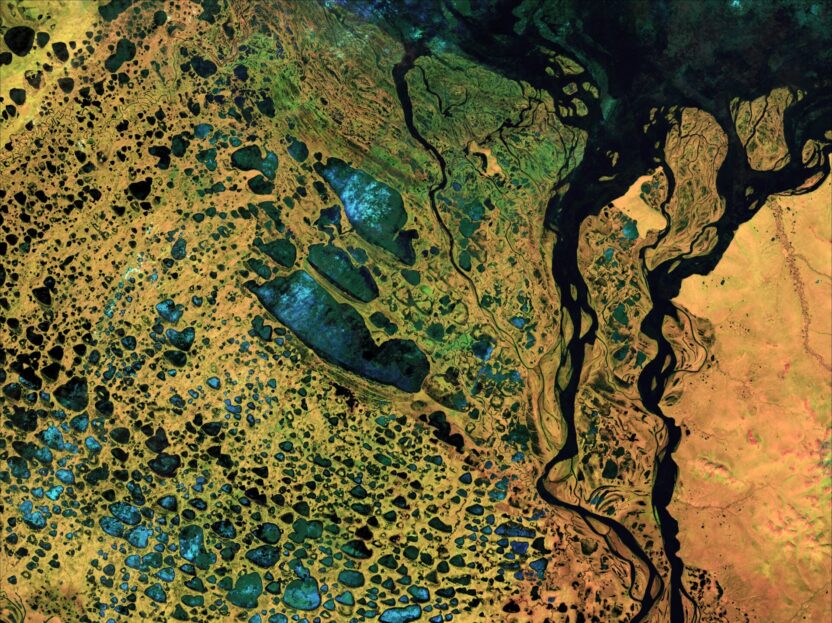
Kolyma River, Russia. Map by Greg Fiske / Woodwell Climate Research Center
Arctic Communications Specialist, Woodwell Climate Research Center
Greg Fiske M.S.Senior Geospatial Analyst, Woodwell Climate Research Center
Christina Shintani M.S.Cartographer, Woodwell Climate Research Center
Cartographers at Woodwell Climate Research Center capture a year of Arctic beauty and change
Explore these 15 maps by award-winning Woodwell Climate cartographers Greg Fiske and Christina Shintani. Created in 2024, each tells a story about the immense beauty of the high north, the dramatic changes unfolding as the Arctic continues to warm three to four times faster than the rest of the world, and the equitable solutions being developed to address climate impacts in the region.
Taz River, Siberia. Map by Greg Fiske / Woodwell Climate Research Center
1. Abrupt permafrost thaw across the Arctic
When permafrost that contains a lot of ice begins to thaw, it causes dramatic and abrupt ground collapse. Known as abrupt thaw, this process has the potential to double the amount of emissions permafrost loses to the atmosphere. To help better understand the impacts that abrupt thaw could have on our global climate, researchers for the Permafrost Pathways project at Woodwell Climate are using the features in this map to train a deep learning model that will identify new and changed features across the circumpolar Arctic.
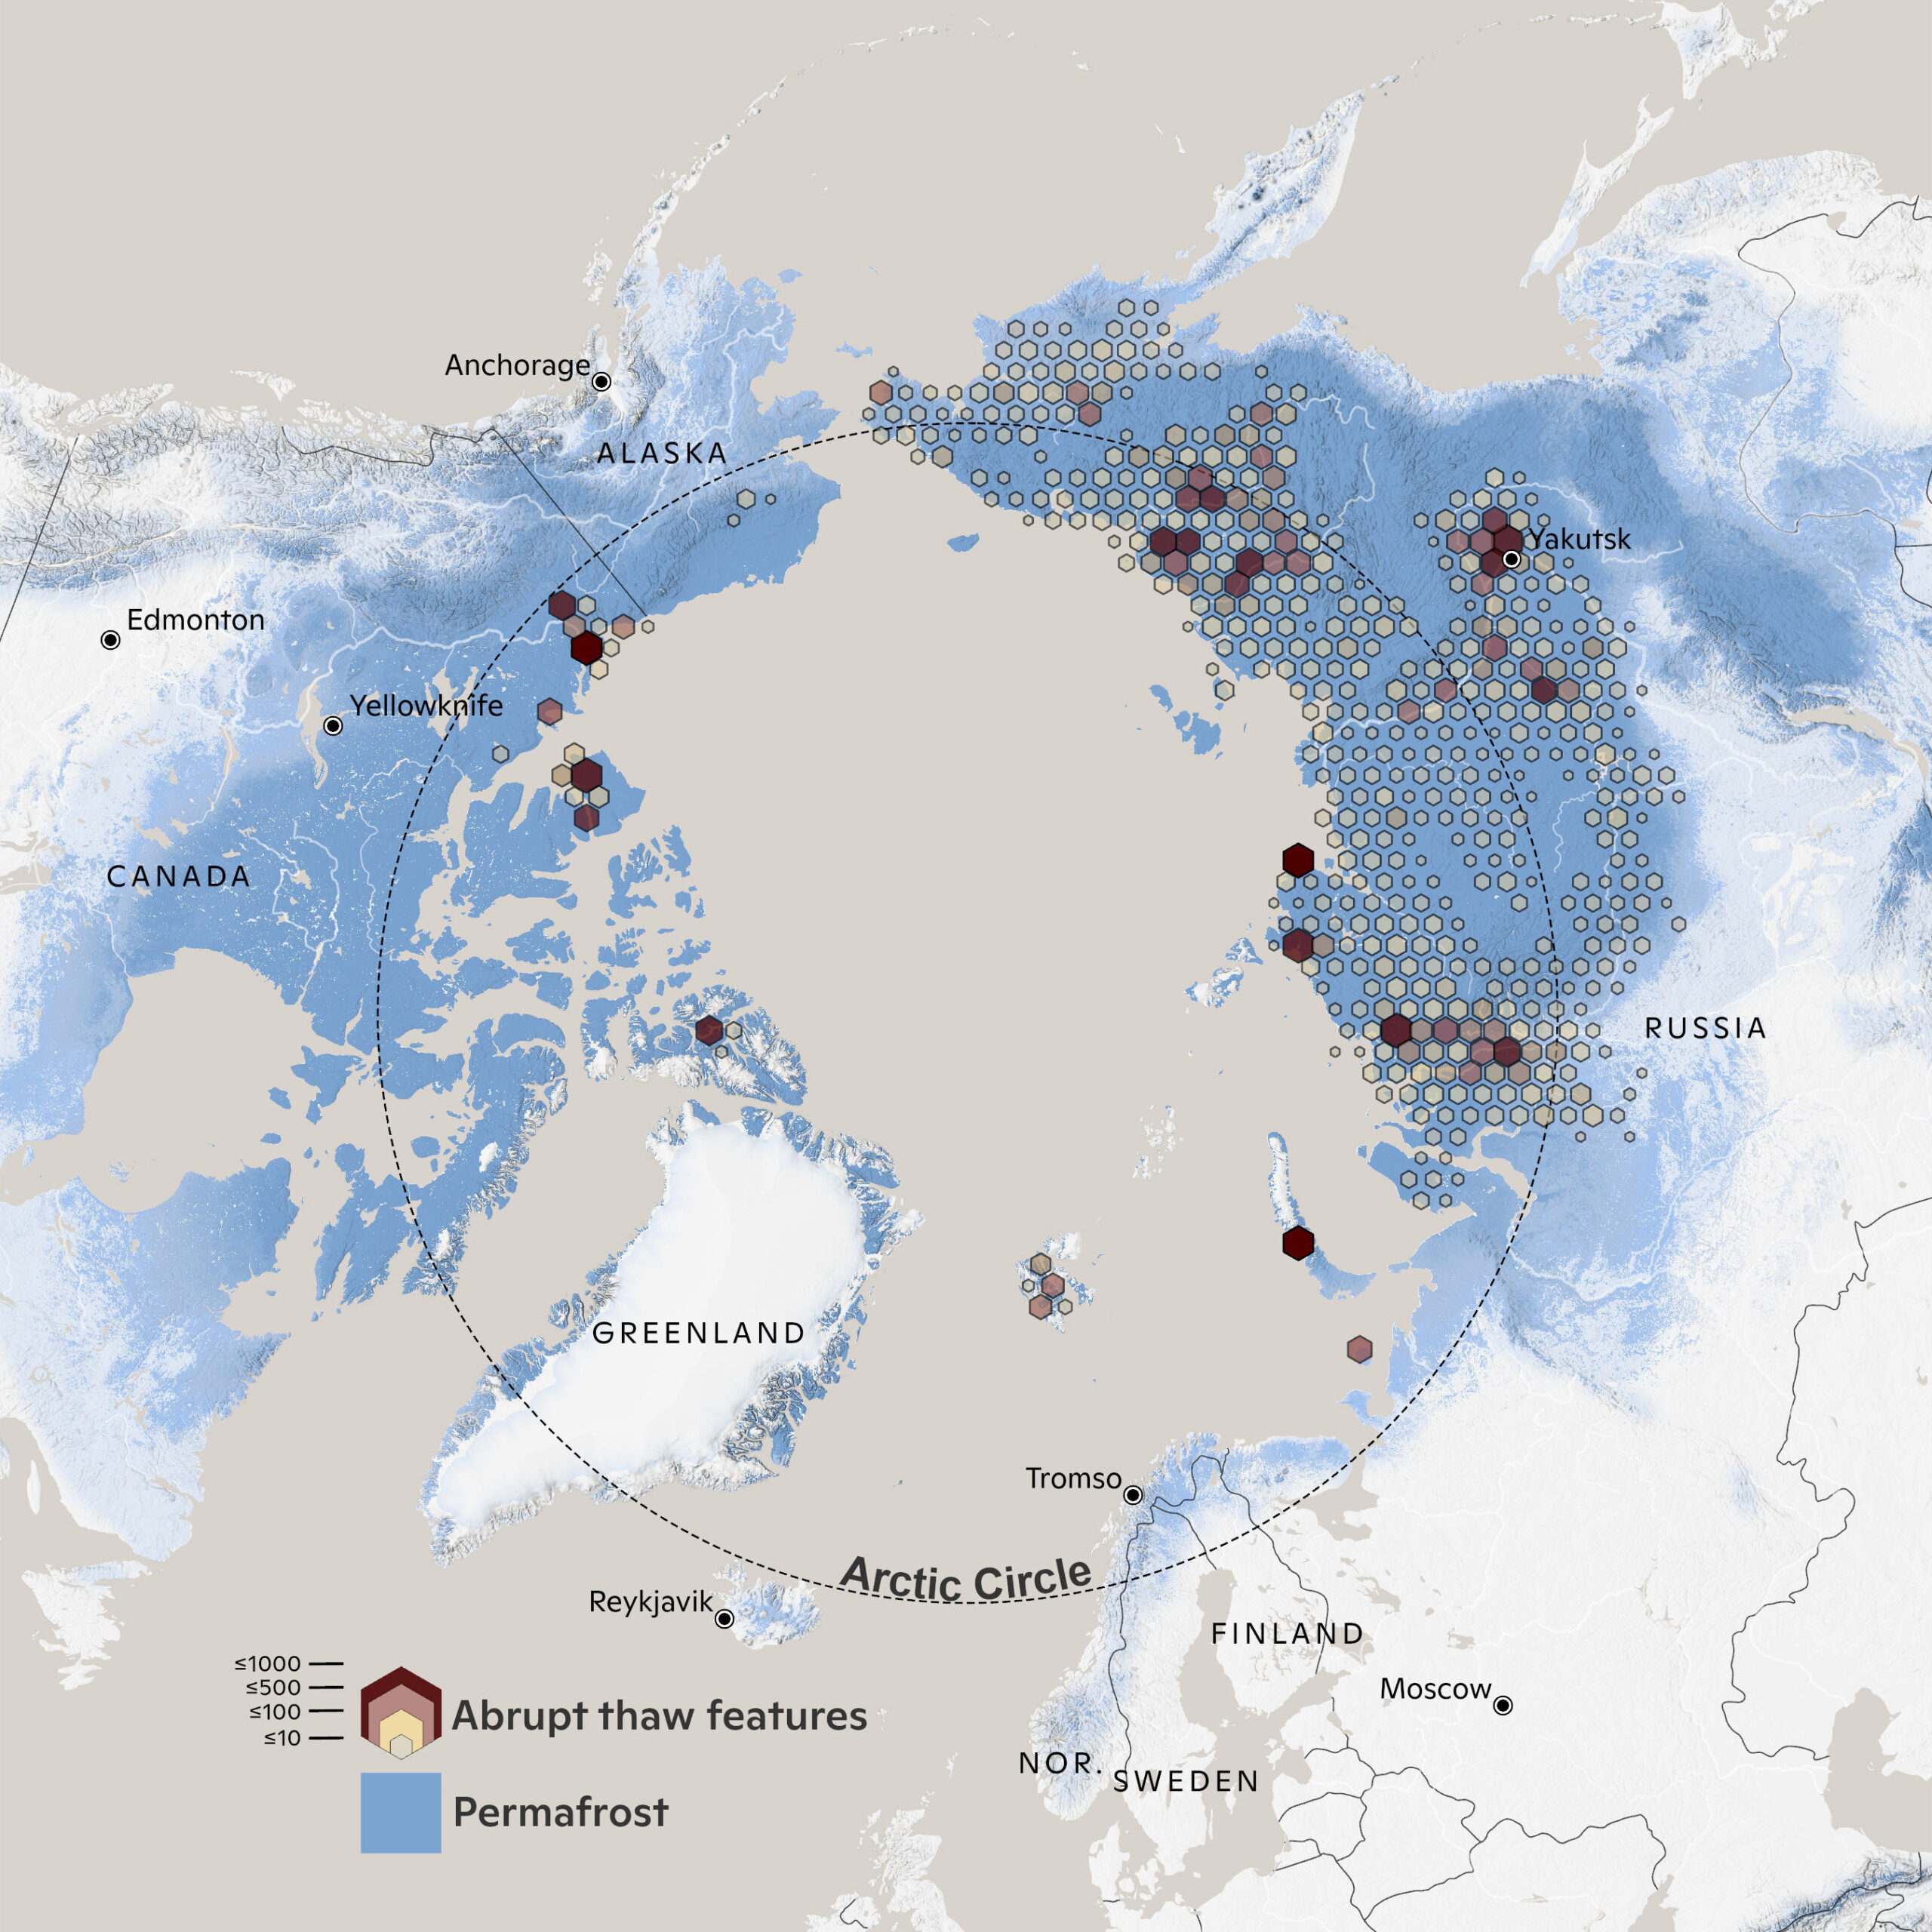
Map by Greg Fiske and Yili Yang / Woodwell Climate Research Center
2. Change in dangerous wildfire days
As northern latitudes warm three to four times faster than the rest of the globe, fire seasons in the boreal region have lengthened, and the number of fire-risk days have increased. Climate and health risks from Northern wildfires include large-scale carbon emissions that can accelerate climate change, poor air quality due to smoke, altered boreal forest ecosystem composition, permafrost degradation, and disproportionate health risks to local communities, particularly Indigenous communities. 2024 was the second-highest year for wildfire emissions north of the Arctic Circle.
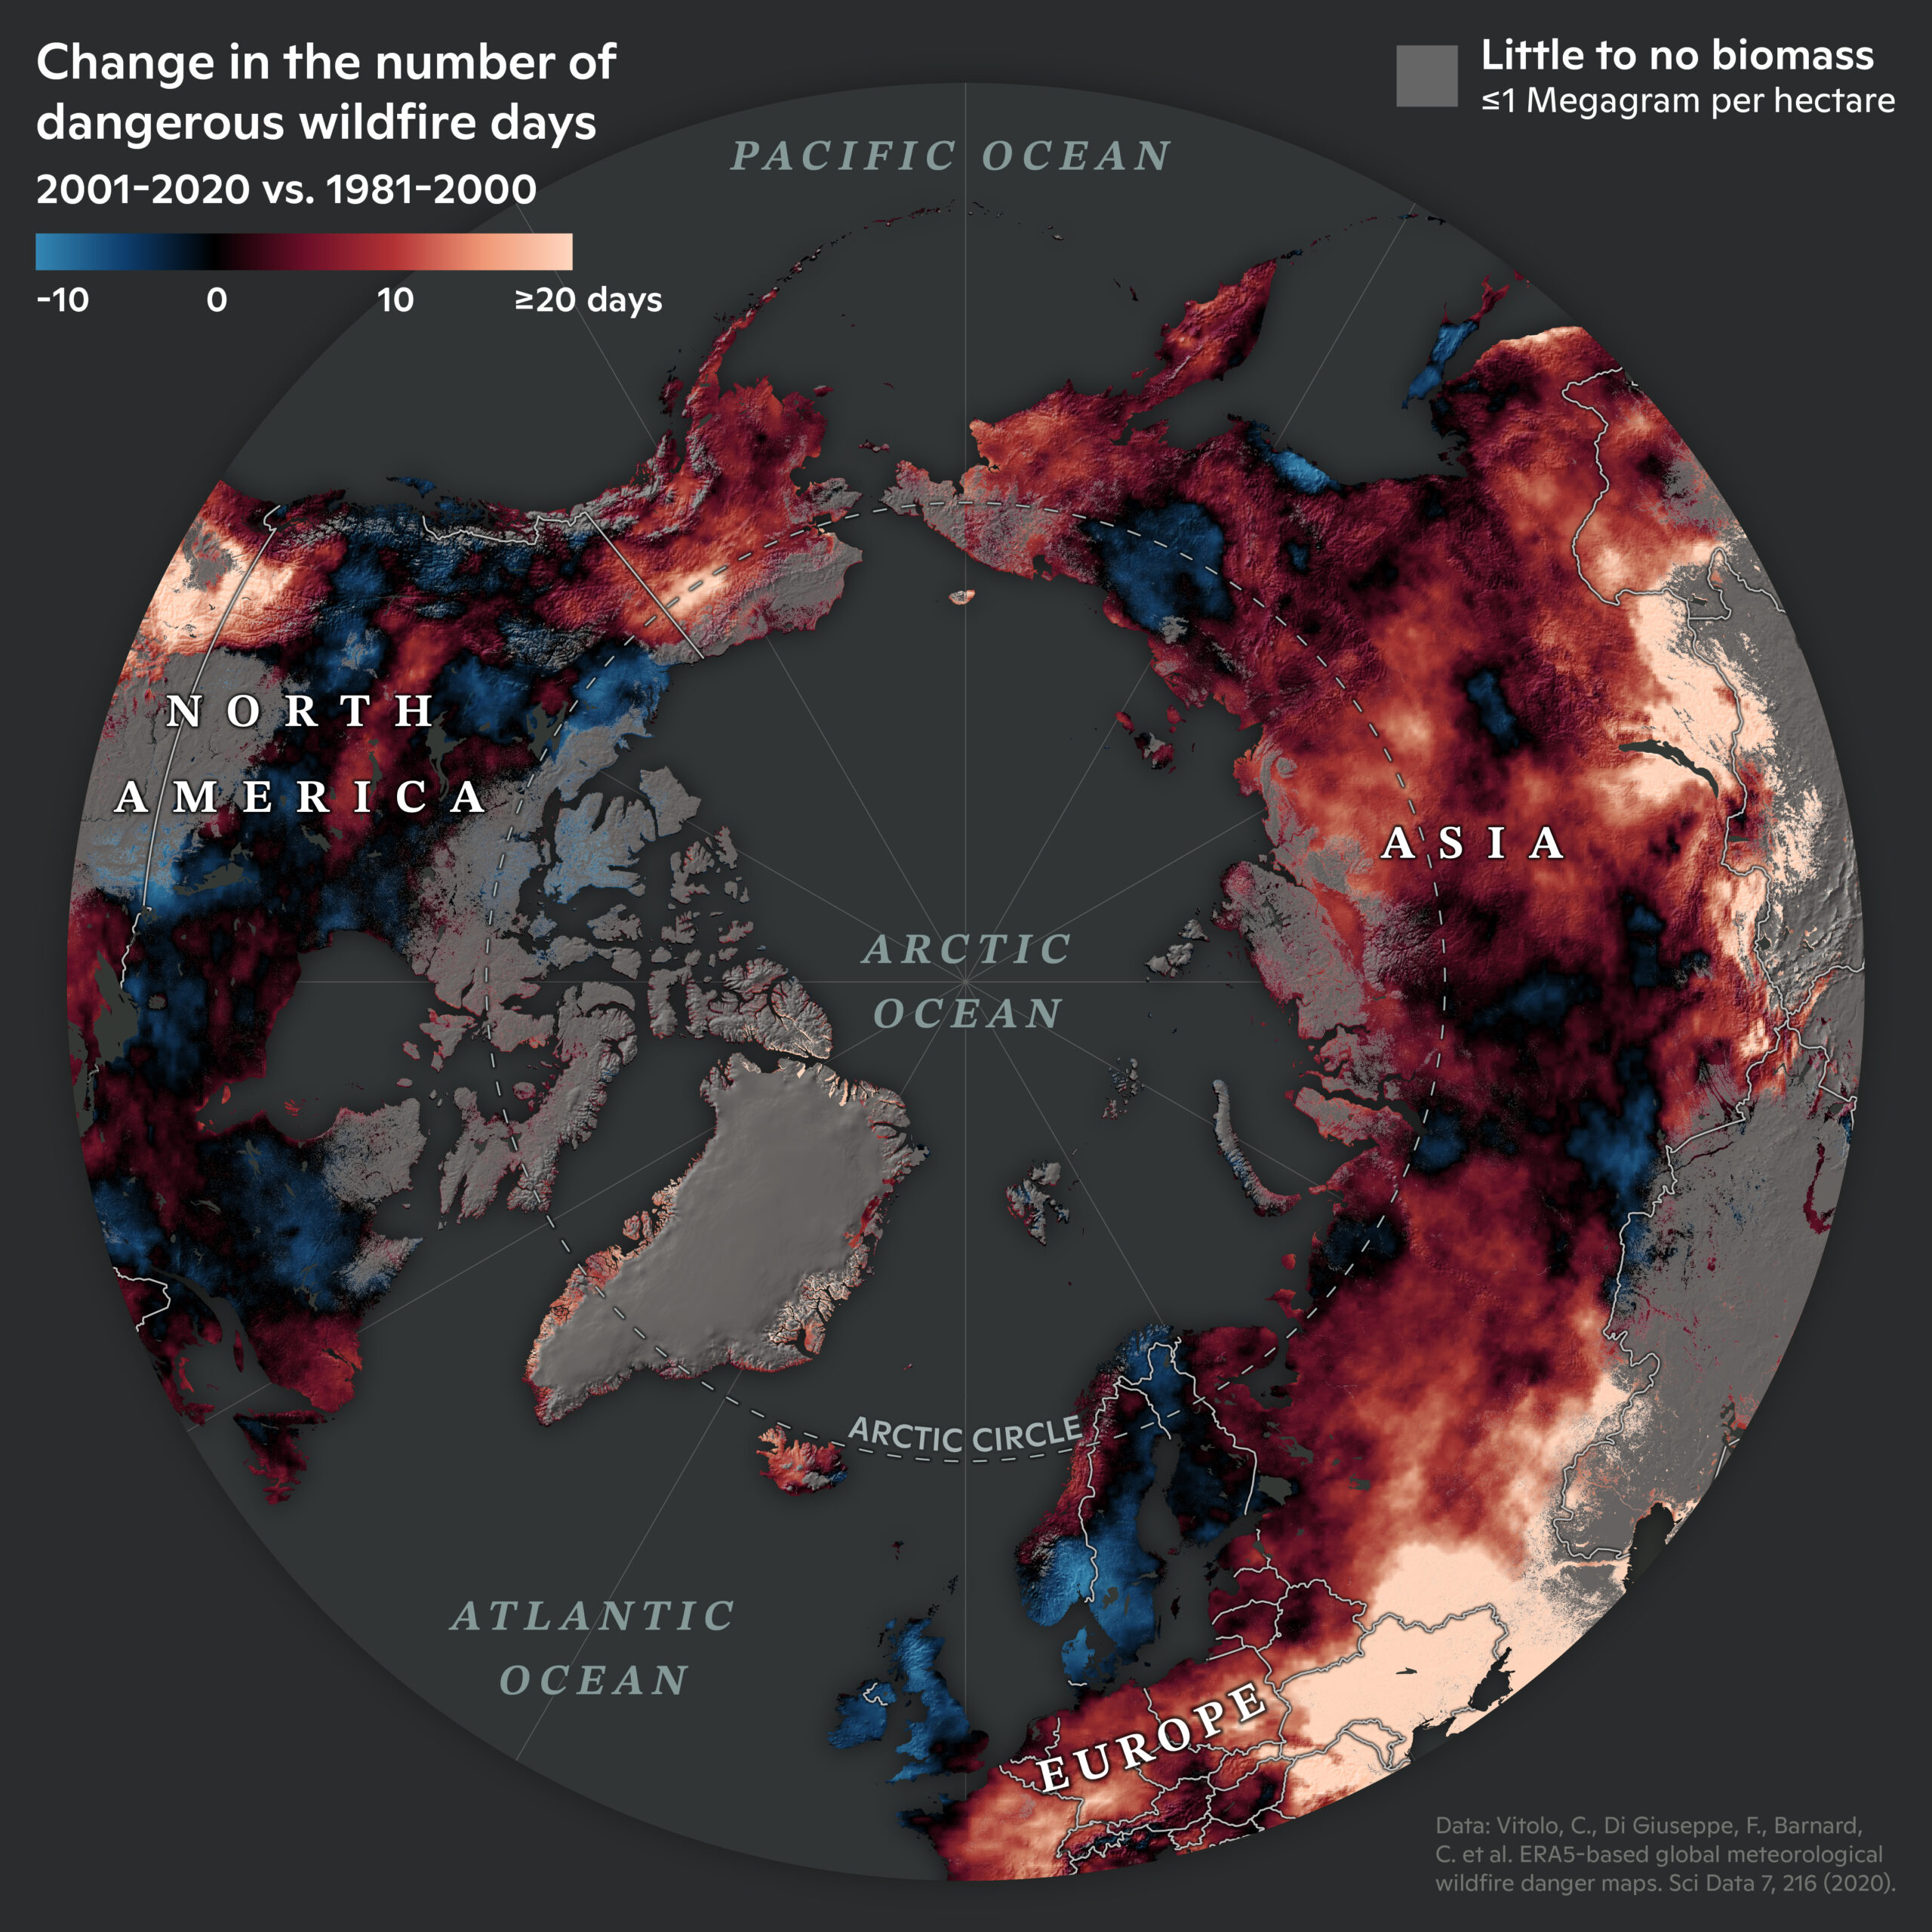
Map by Christina Shintani / Woodwell Climate Research Center
3. Pan-Arctic carbon sources and sinks
While the Arctic has been a carbon sink for thousands of years—storing more carbon than it releases—new research led by Permafrost Pathways scientists at Woodwell Climate found that one-third of the Arctic tundra is now a carbon source.
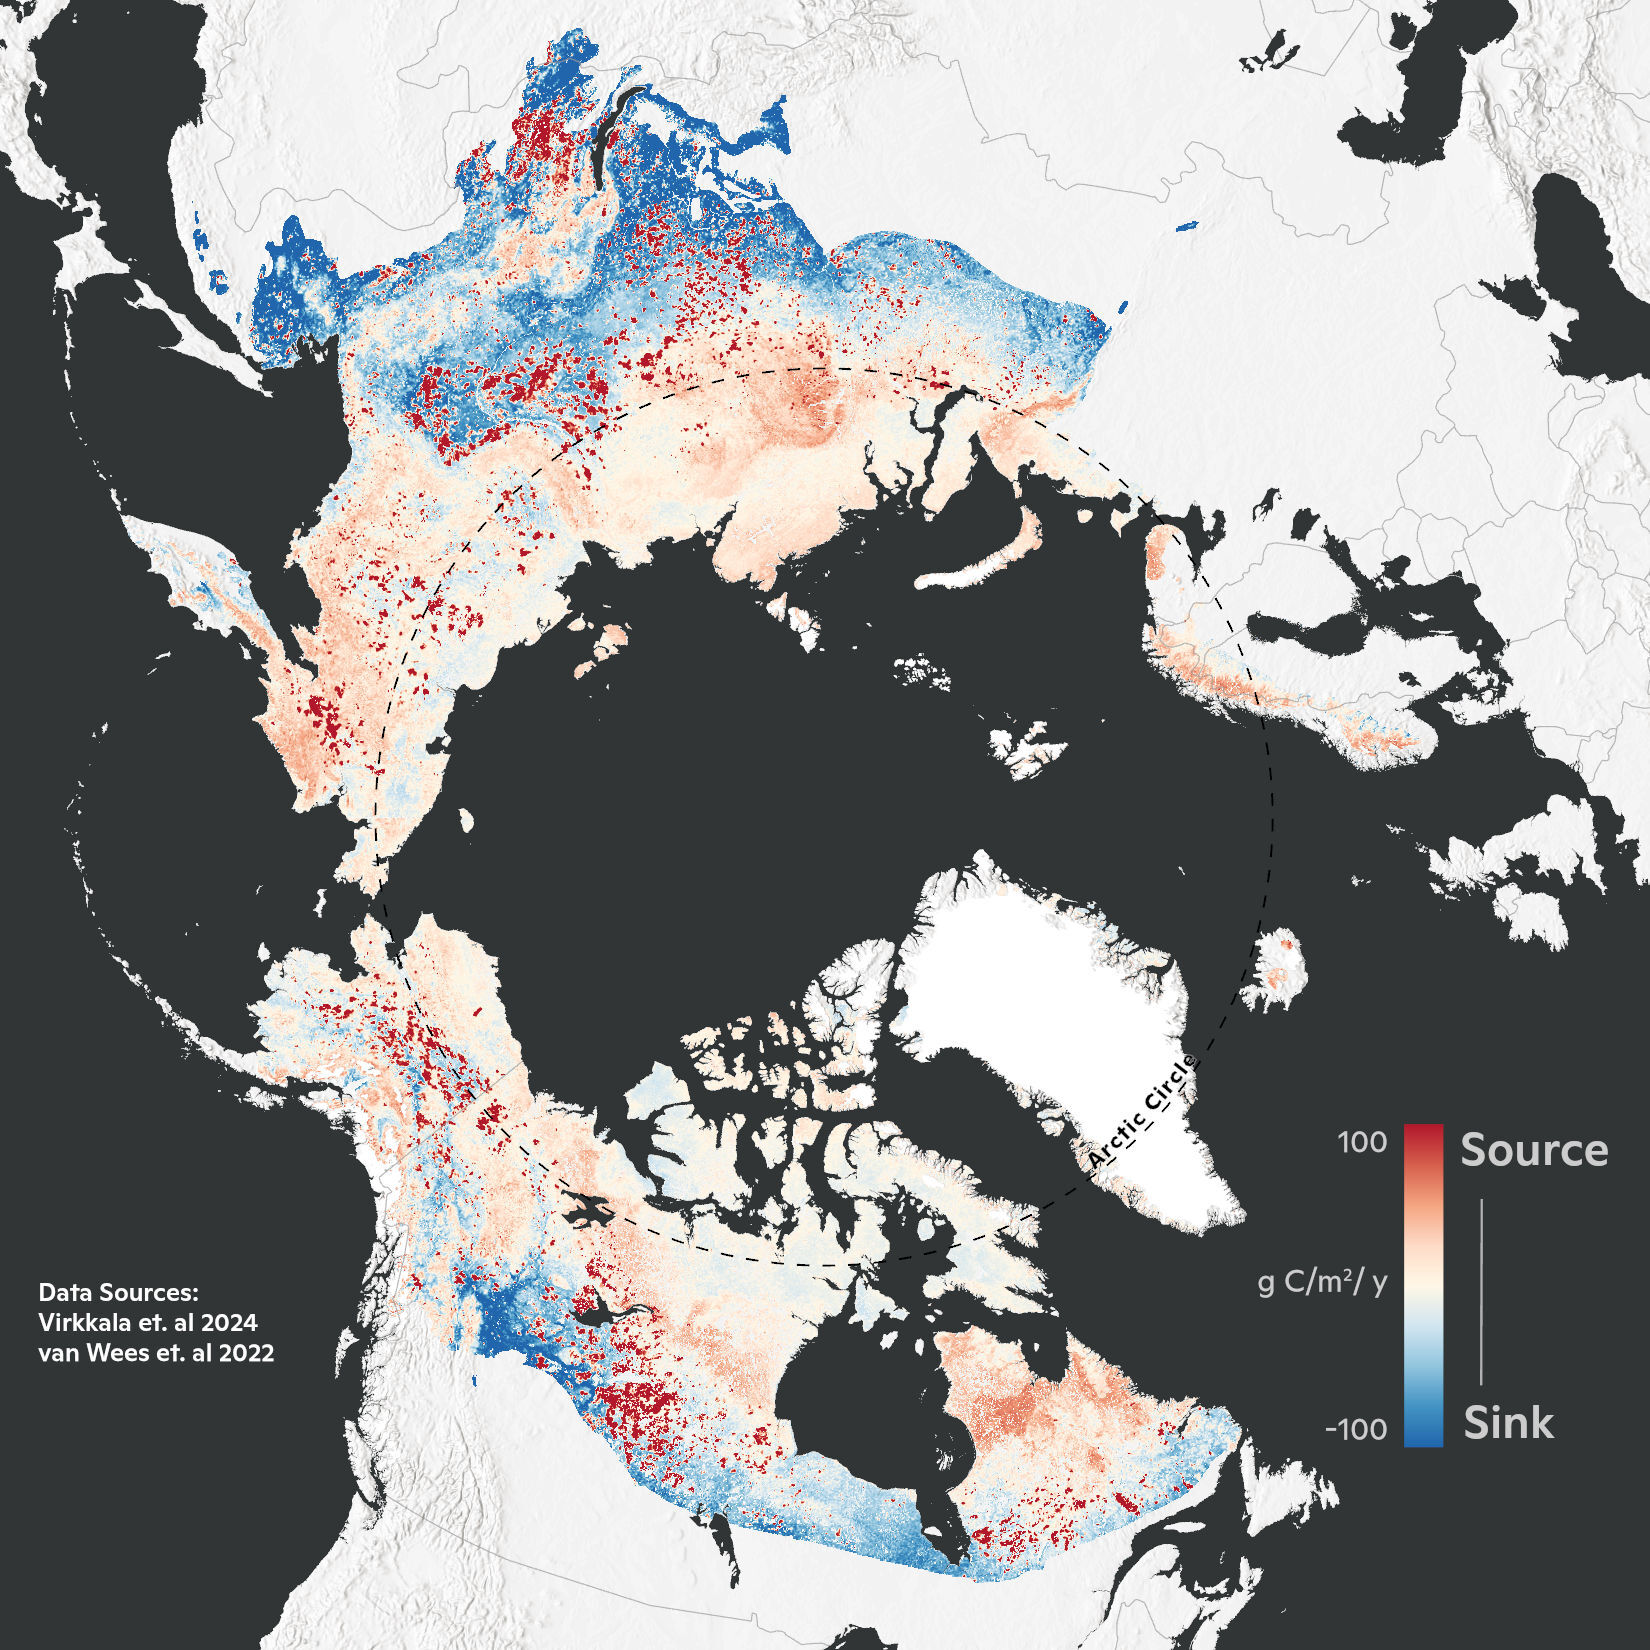
Map by Greg Fiske / Woodwell Climate Research Center
4. Cumulative burned area of the Arctic-Boreal zone
This map of cumulative burned area in the Arctic-boreal zone took center stage at the 2024 Arctic Circle Assembly. Collaborator Edward Alexander from Gwich’in Council International joined a panel conversation with Sen. Lisa Murkowski, spotlighting wildfire in the North, management approaches, and Indigenous-led solutions. Sen. Murkowski cited statistics from Woodwell Climate’s research, noting a pilot project led by Dr. Brendan Rogers and Dr. Peter Frumhoff on fire suppression as a promising solution. (Data source 1; Data source 2)
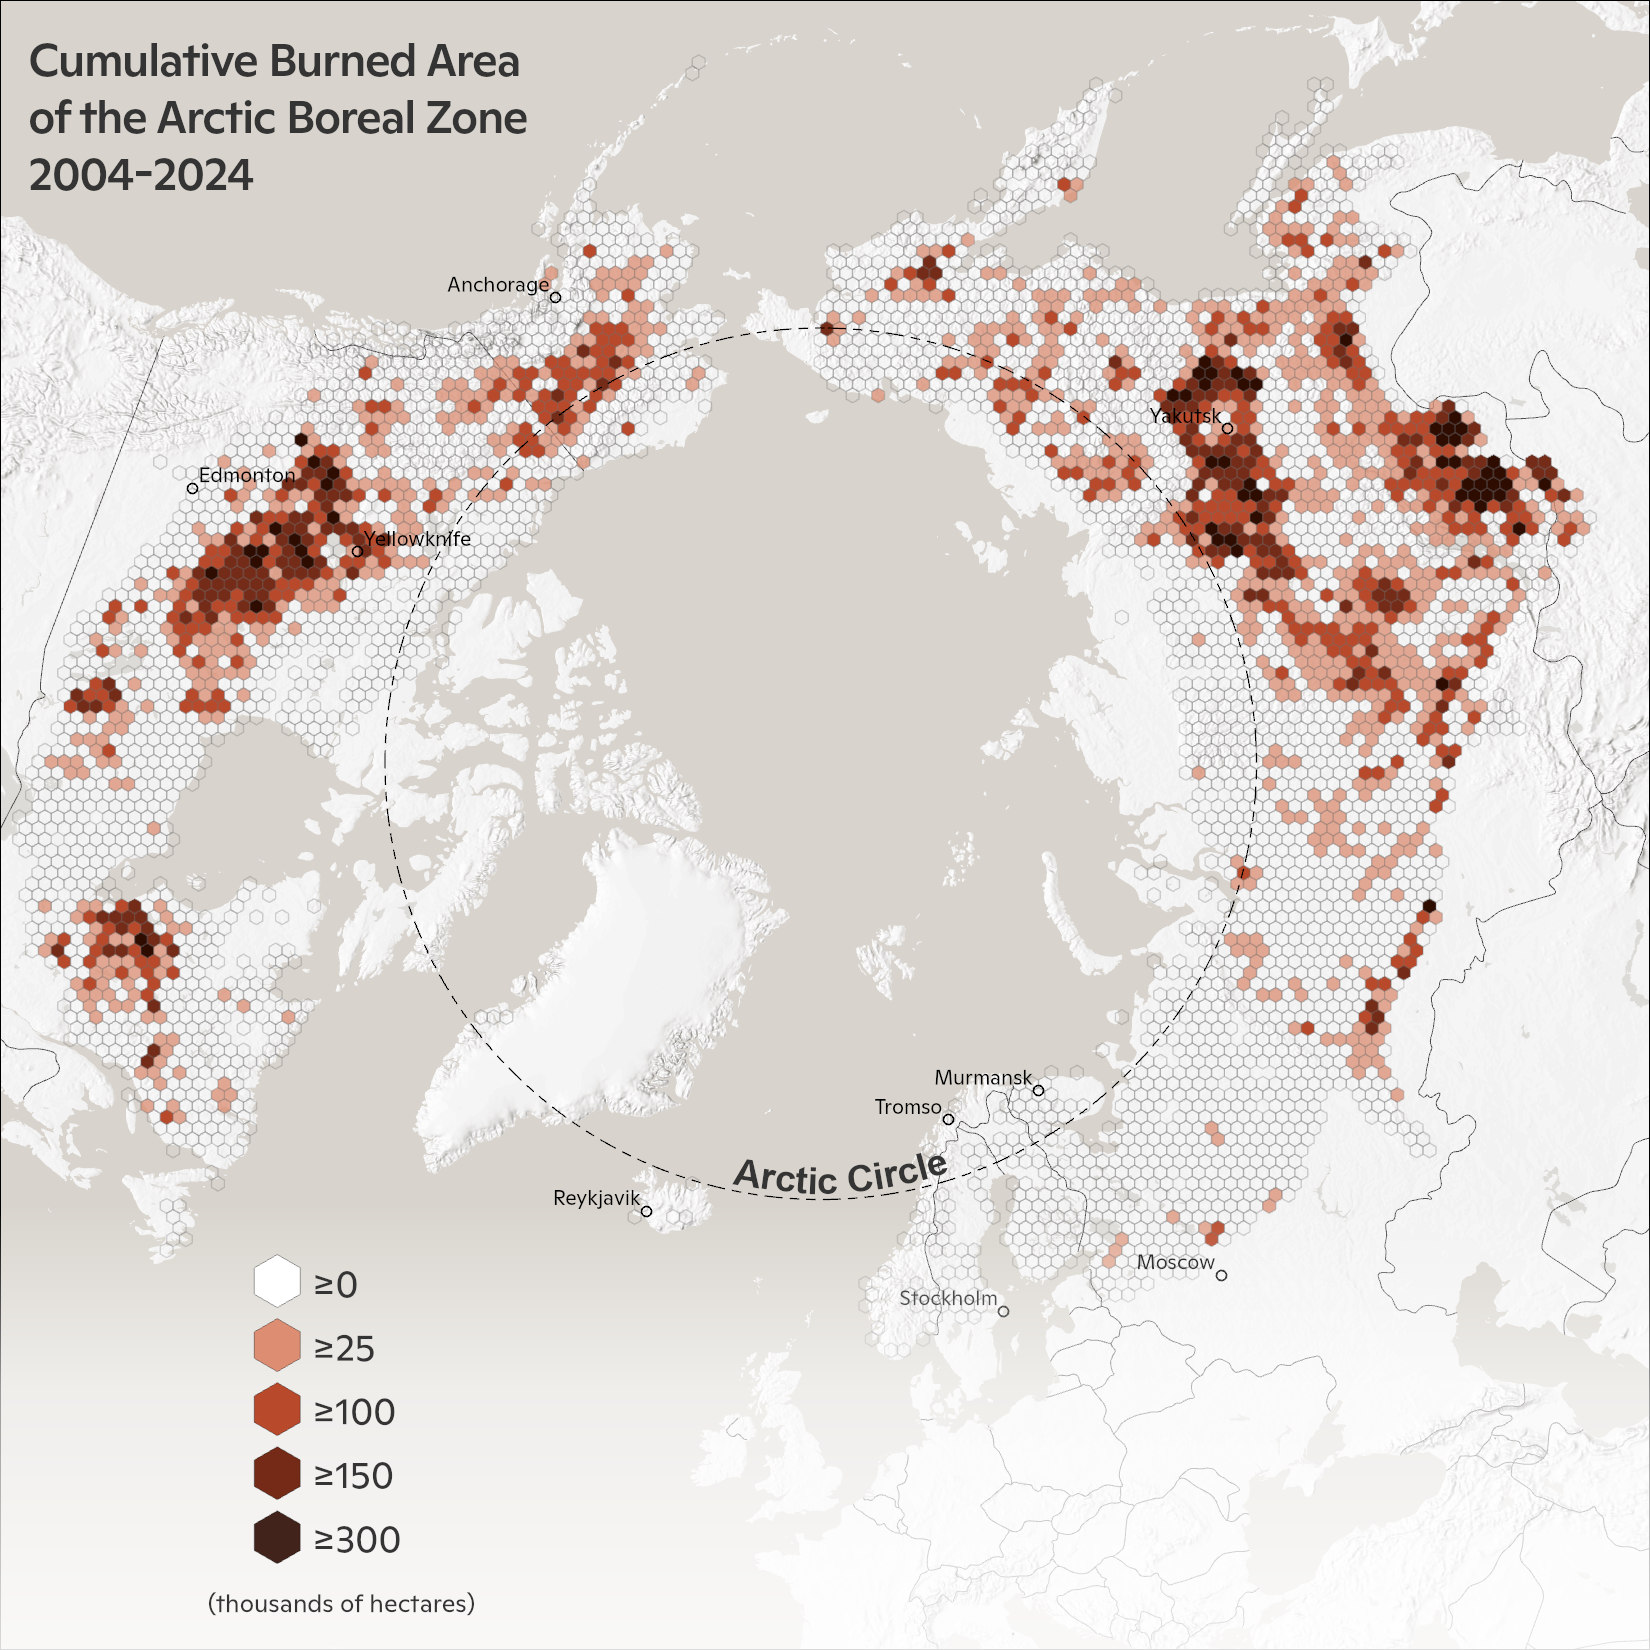
Map by Greg Fiske / Woodwell Climate Research Center
5. Predicted change in aboveground boreal biomass by 2030
Decreases in aboveground biomass are seen in areas that are susceptible to drought and have shown early warning signals of tree mortality from remotely sensed imagery. Increases in aboveground biomass are seen in younger tree stands and faster-growing temperate forests.
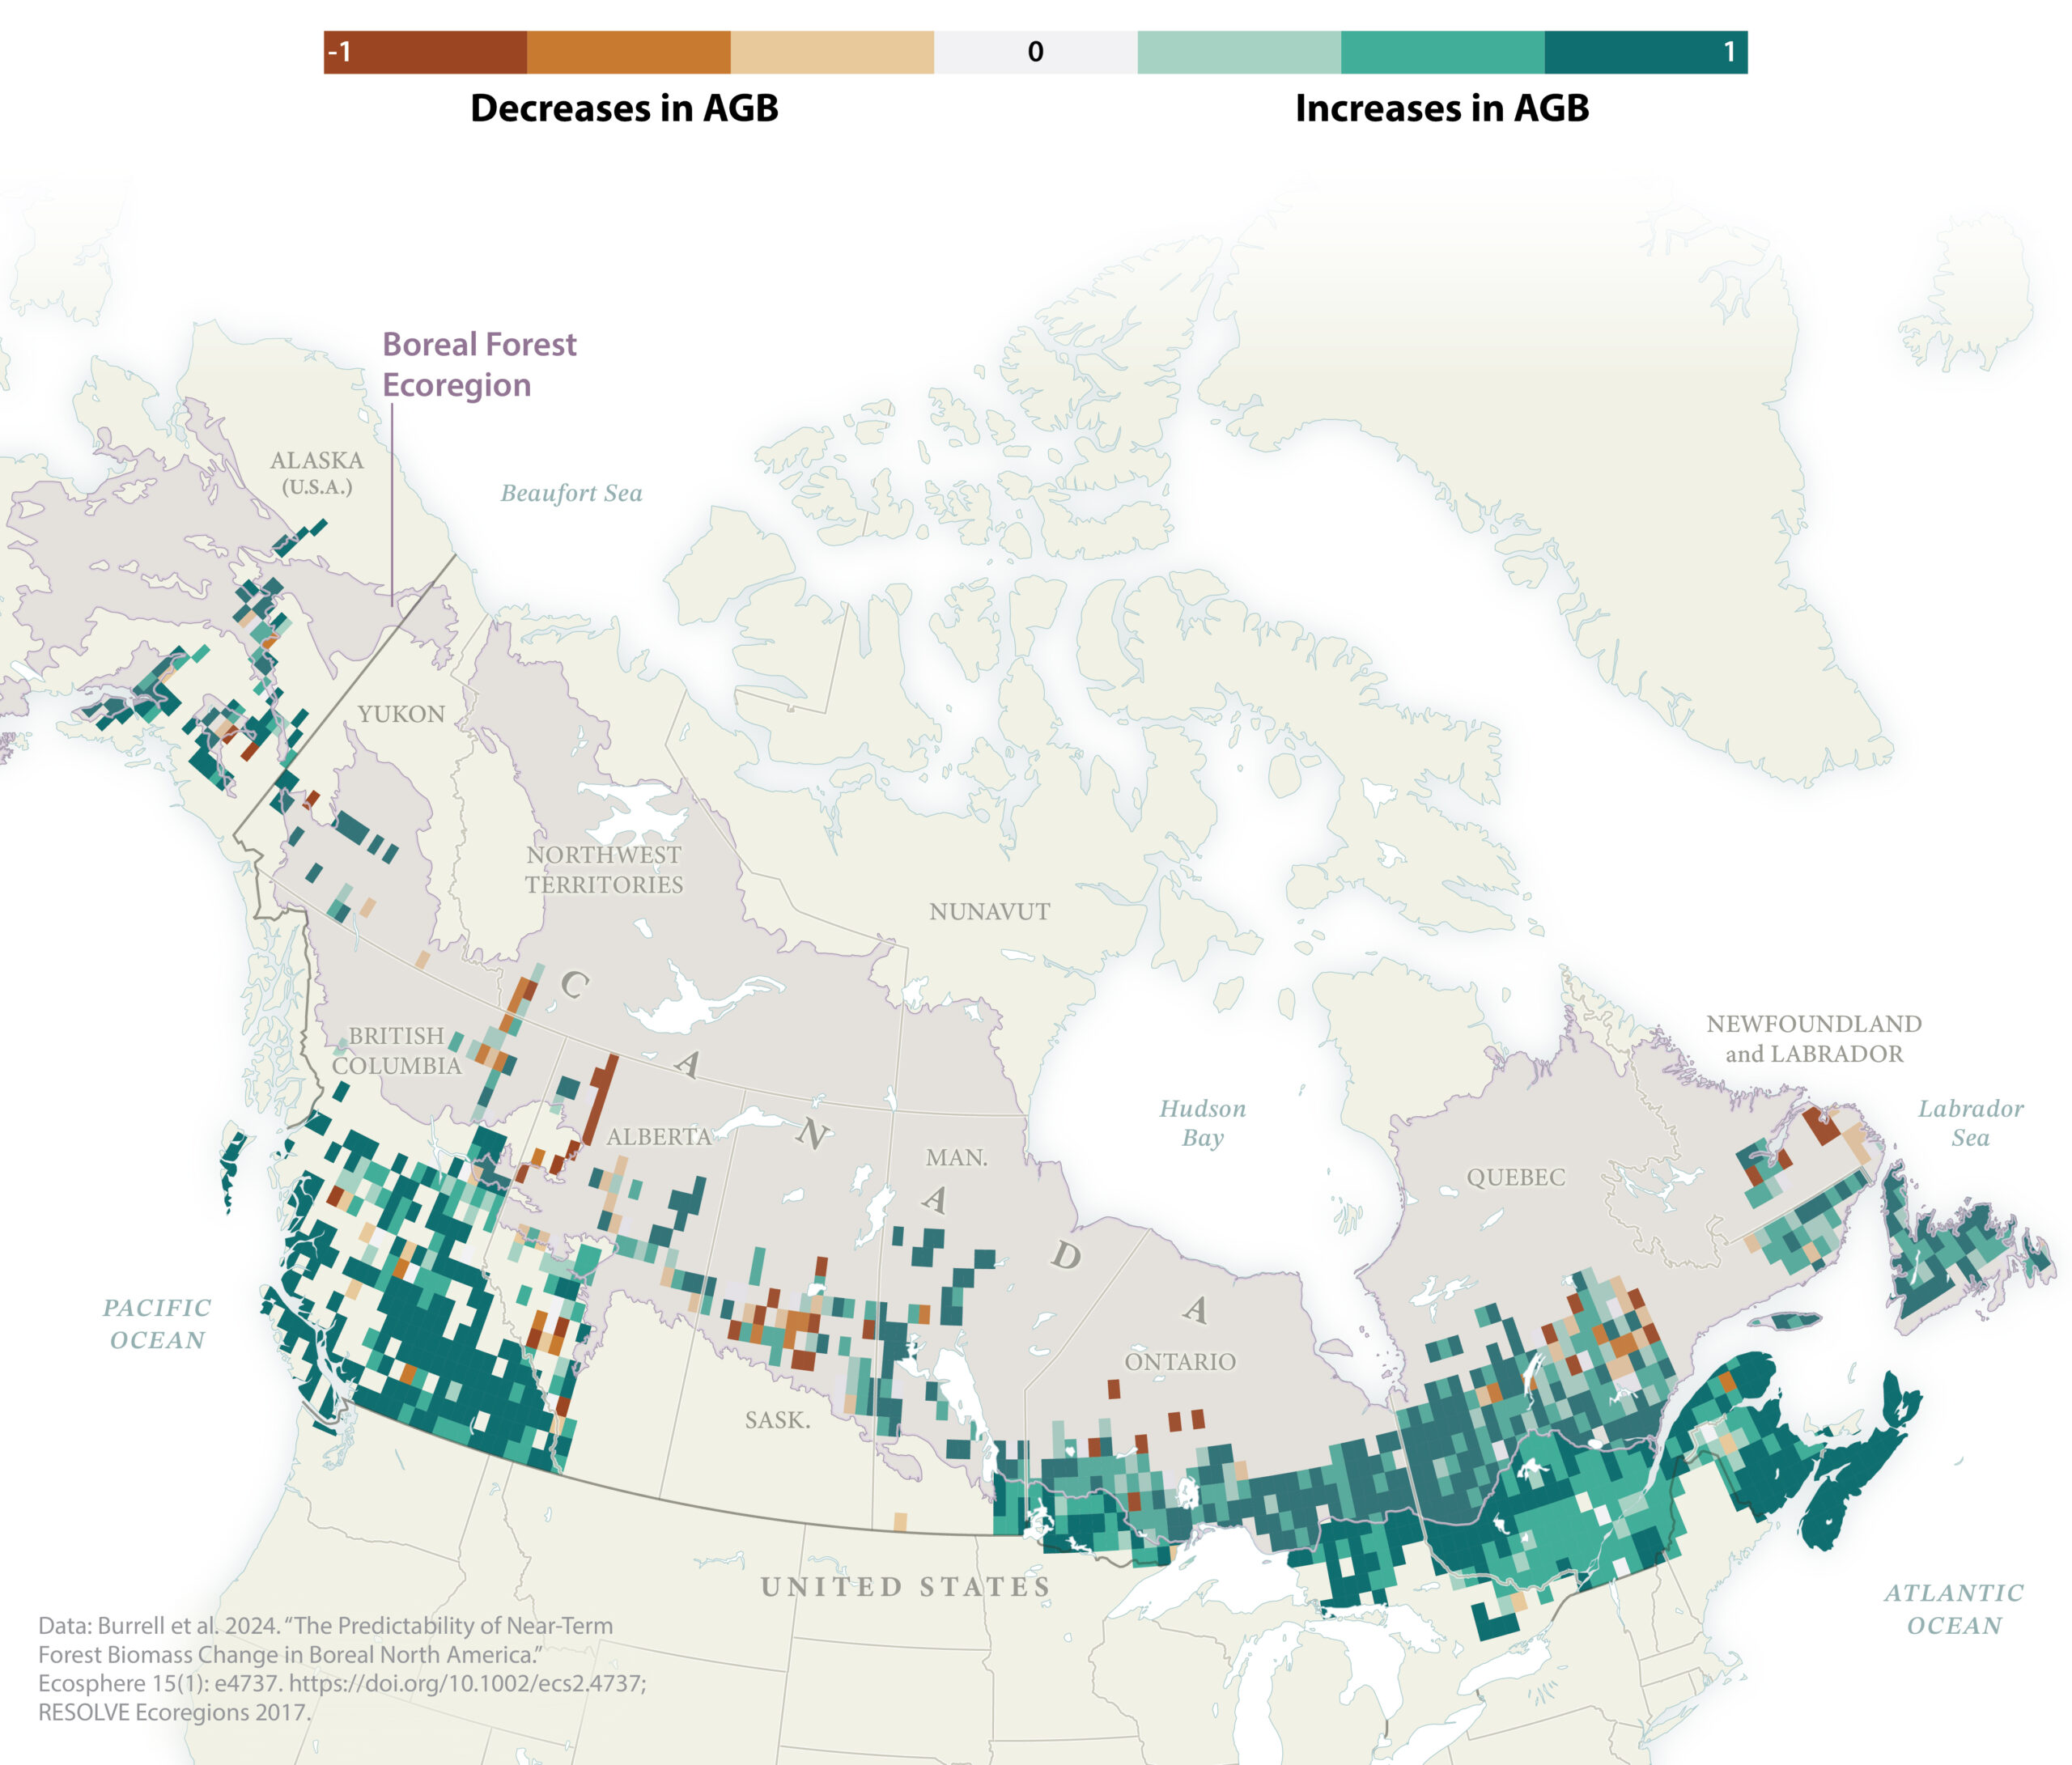
Map by Christina Shintani
6. Alaska Native languages and cultures
Alaska is home to 229 Tribes and 11 Native language families with at least 20 distinct languages, reflecting the diverse cultural heritage of Alaska Native peoples. (Data source)
Permafrost Pathways has been working with Alaska Native partners to build GIS capacity within communities.
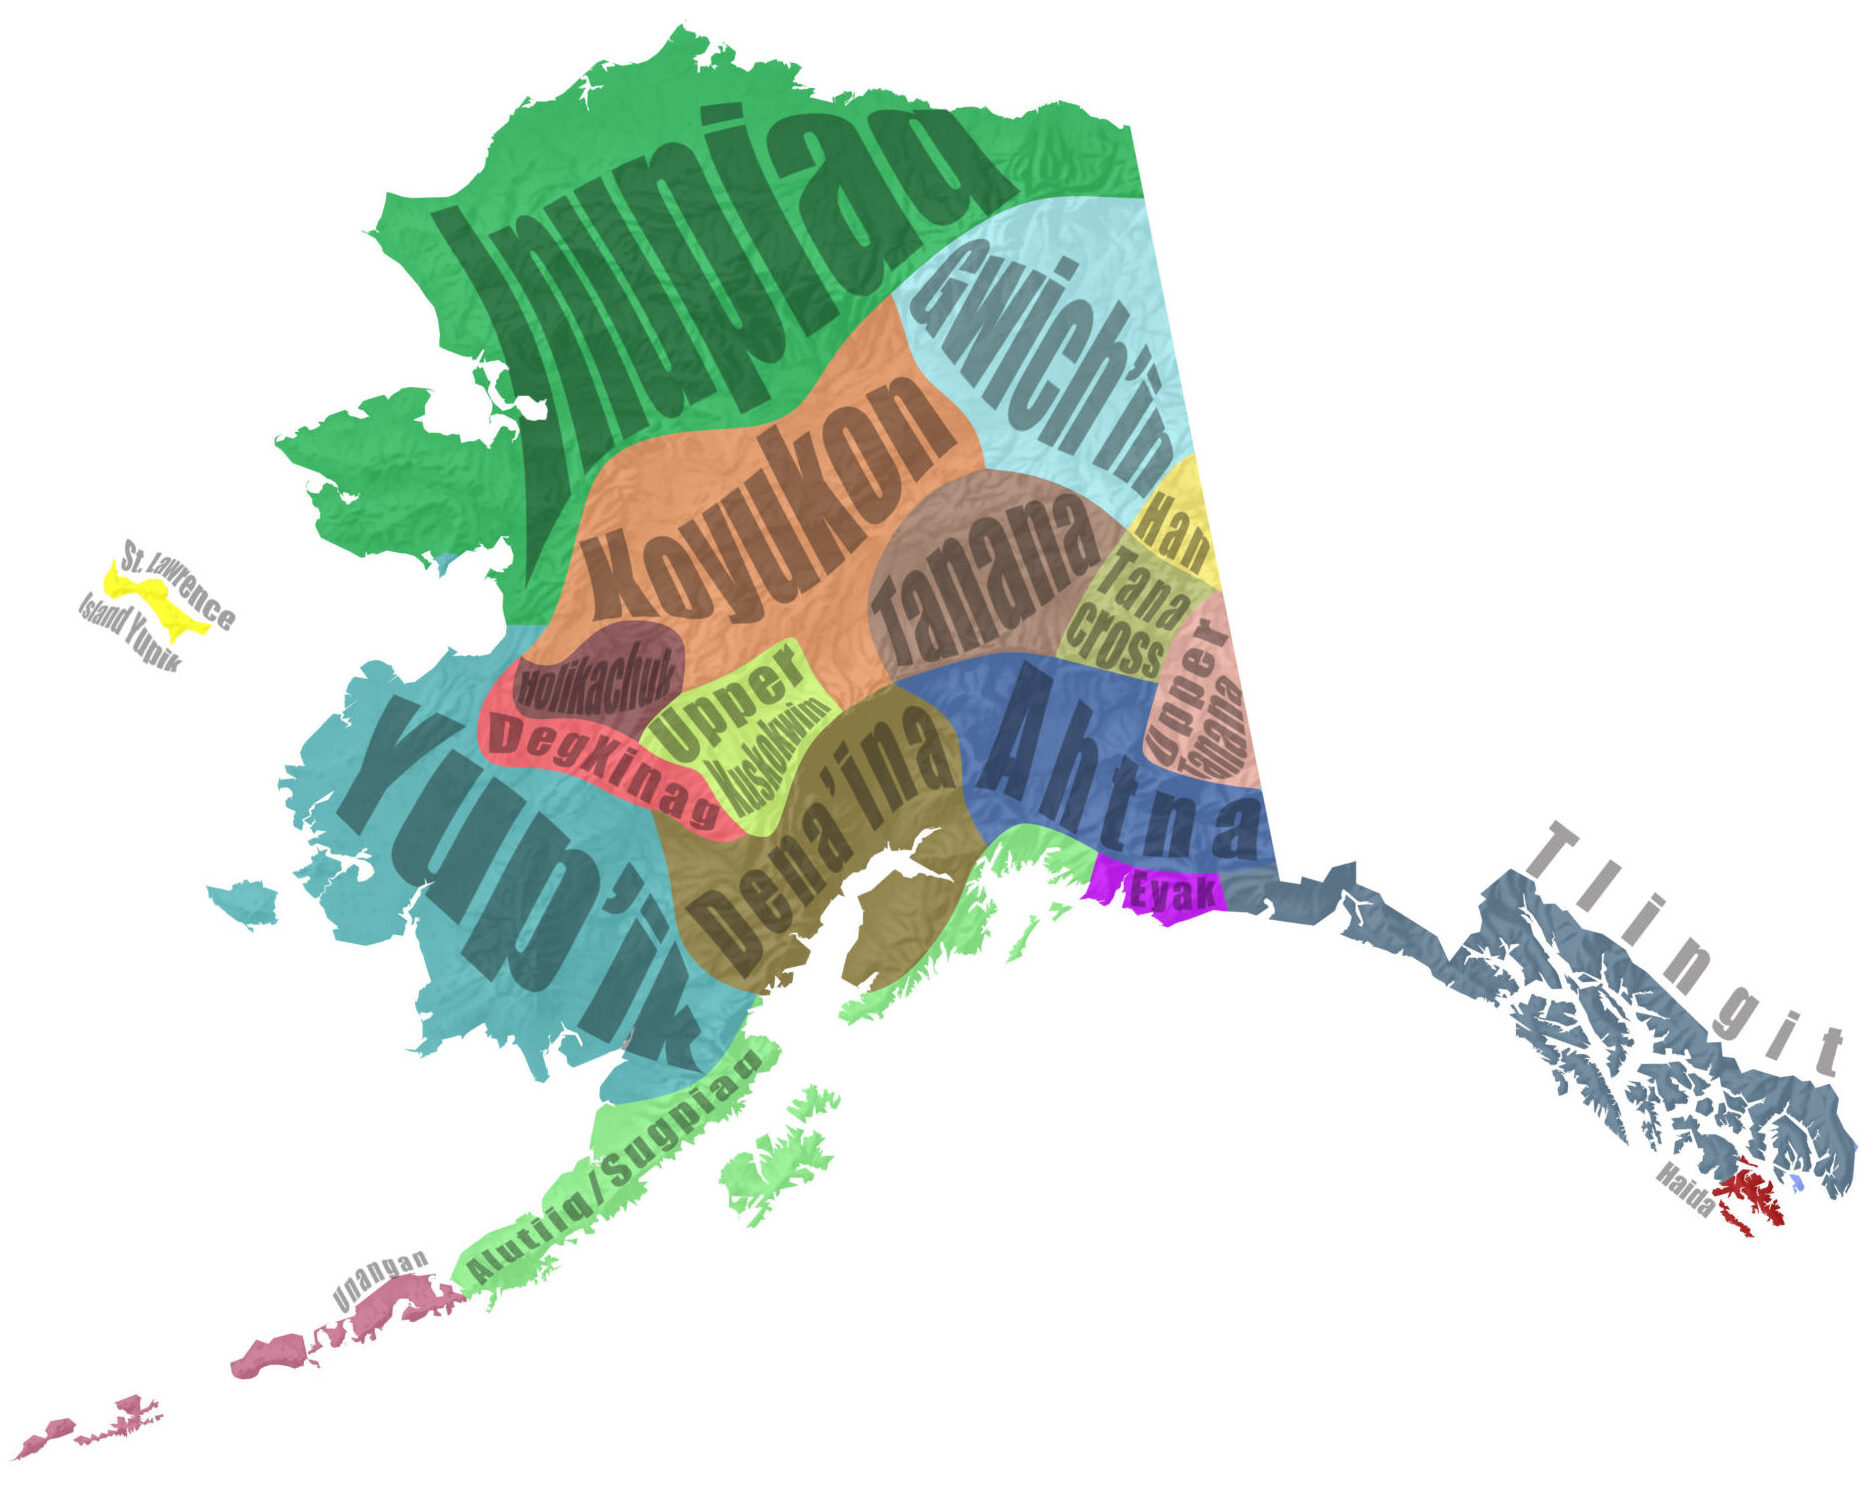
Map by Greg Fiske / Woodwell Climate Research Center
7. Yukon-River Delta, Alaska
An artistic rendition of the Yukon River Delta in Alaska. By combining satellite imagery bands 4 (red), 3 (green), and 1 (coastal aerosol band) from the Sentinel2 platform (Copernicus Sentinel-2 mission, ESA), we are able to see sediment within the water. The sediment in this image was recolored to a fire-like yellow to stand out from the surrounding land and deep ocean. This map was on display as part of the “In Flux: Perspectives on Arctic Change” art exhibit at Highfield Hall in Falmouth, Massachusetts.
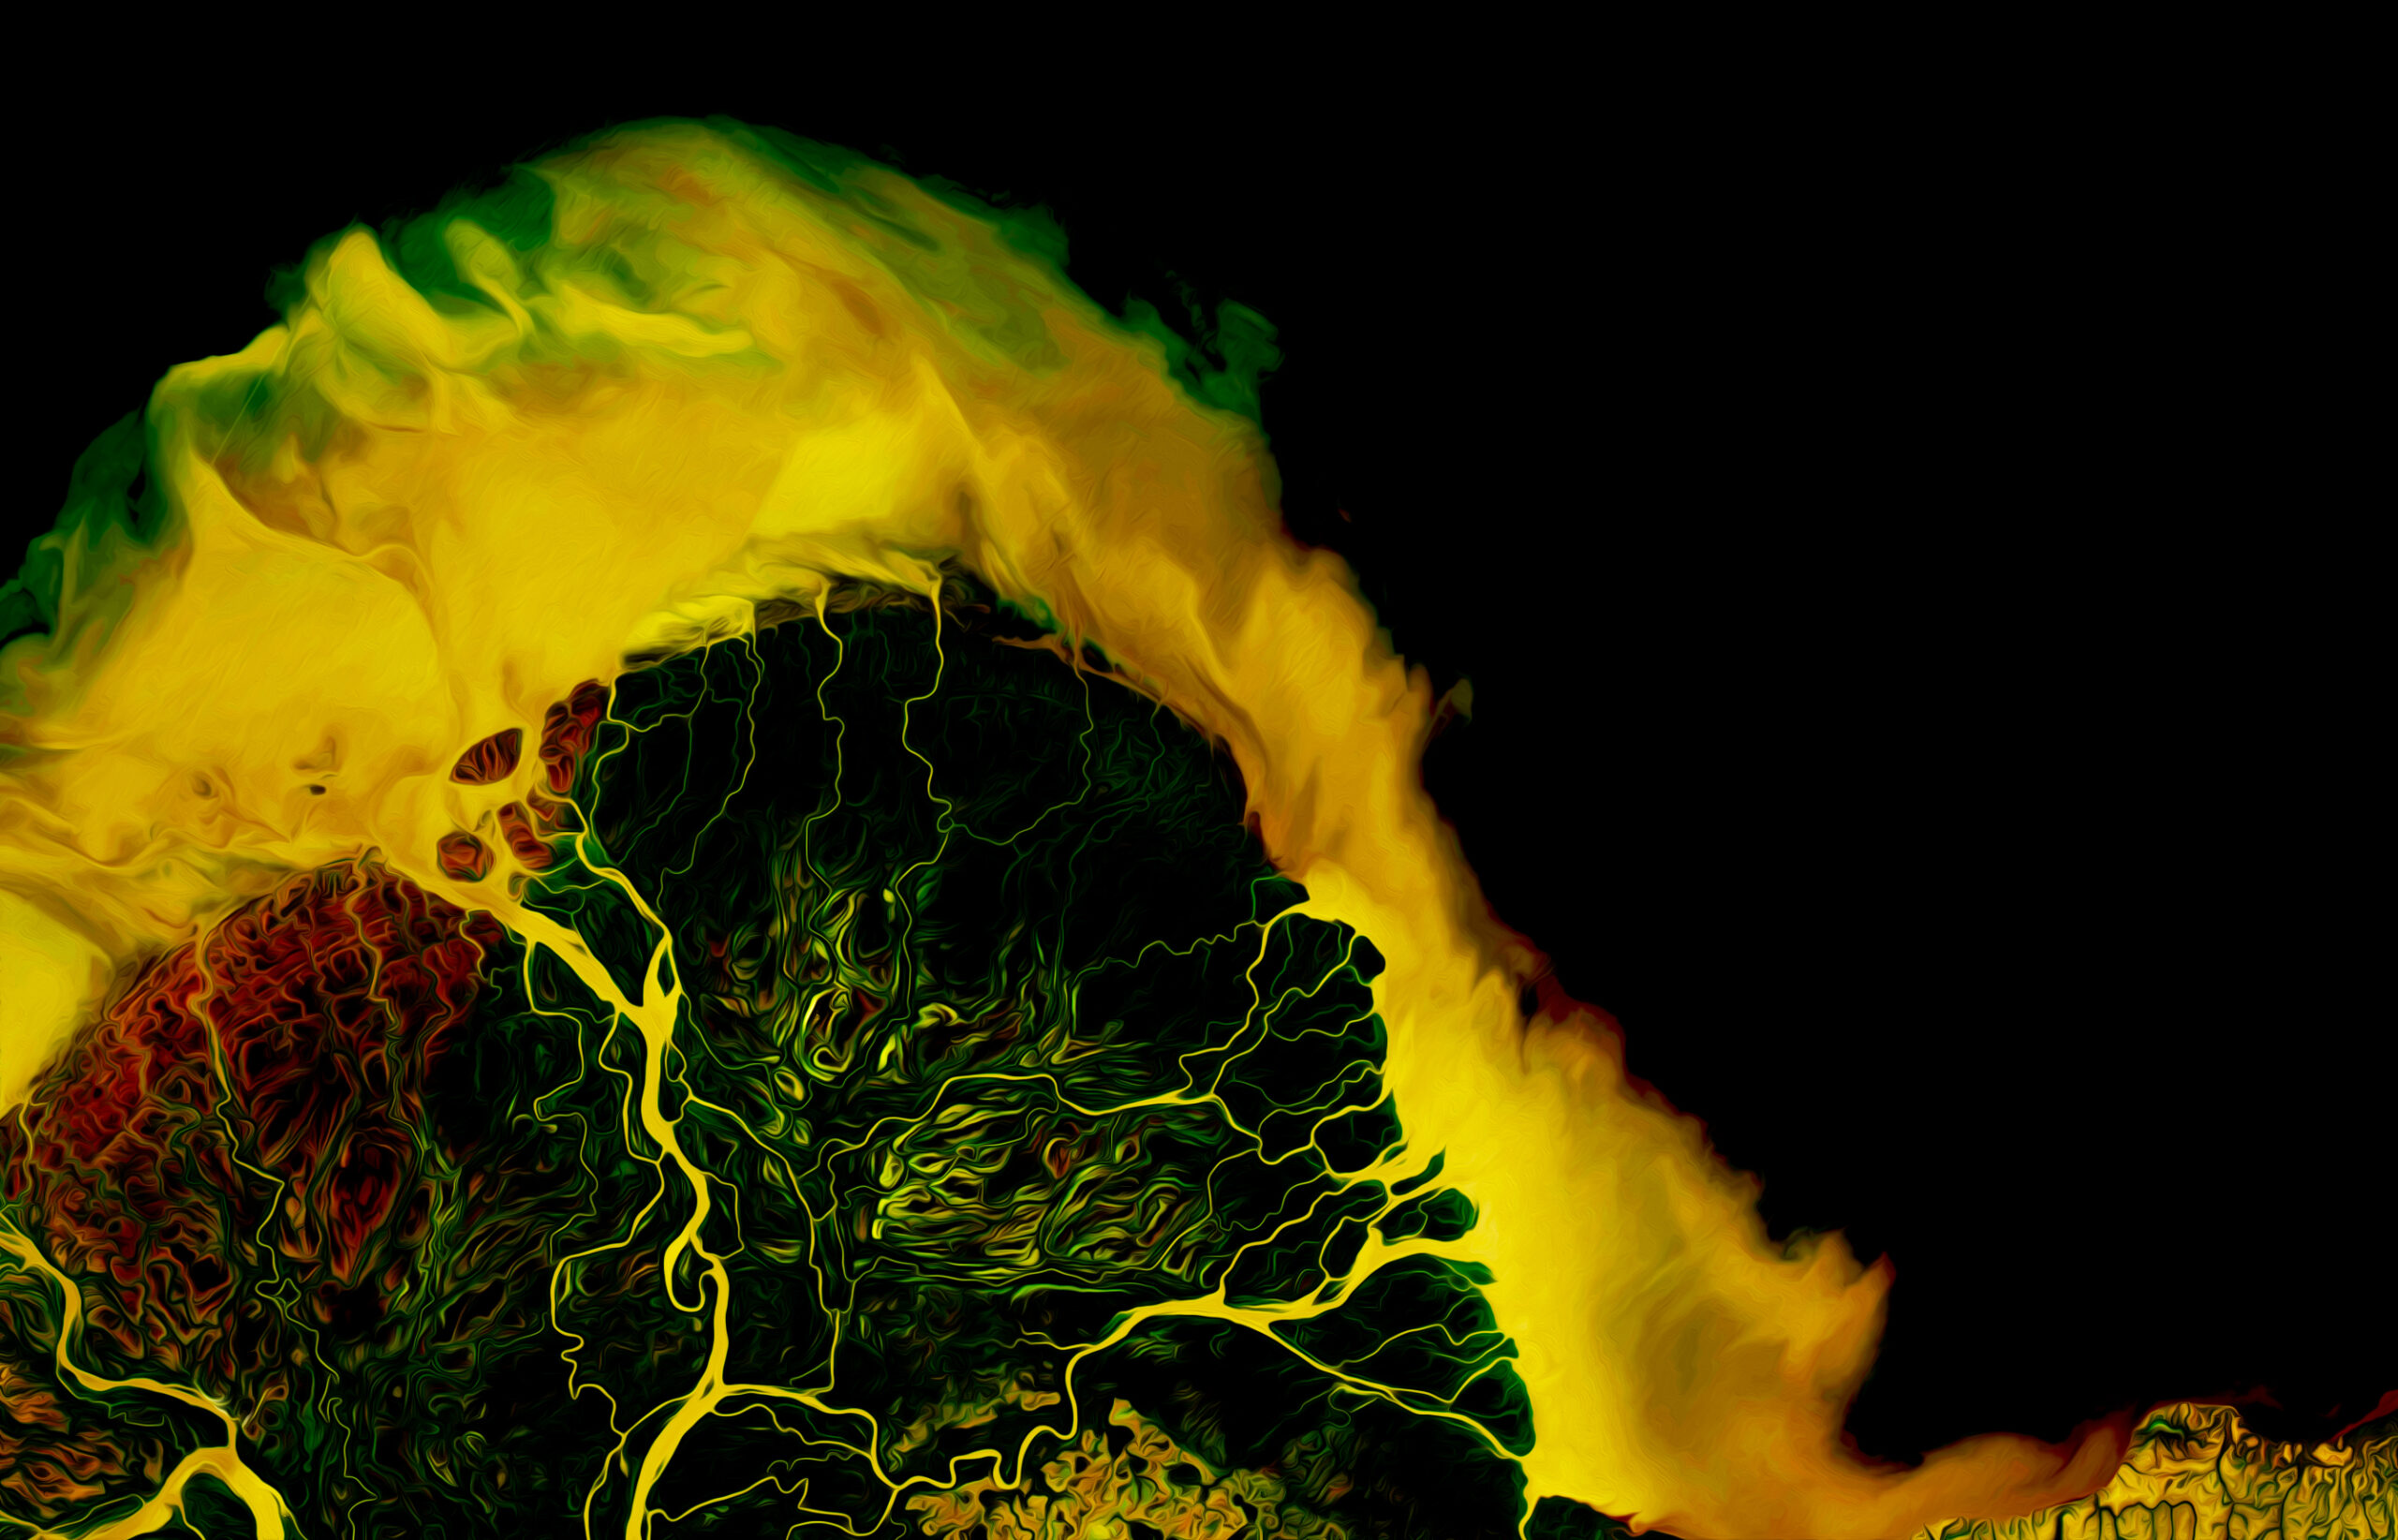
Map by Greg Fiske / Woodwell Climate Research Center
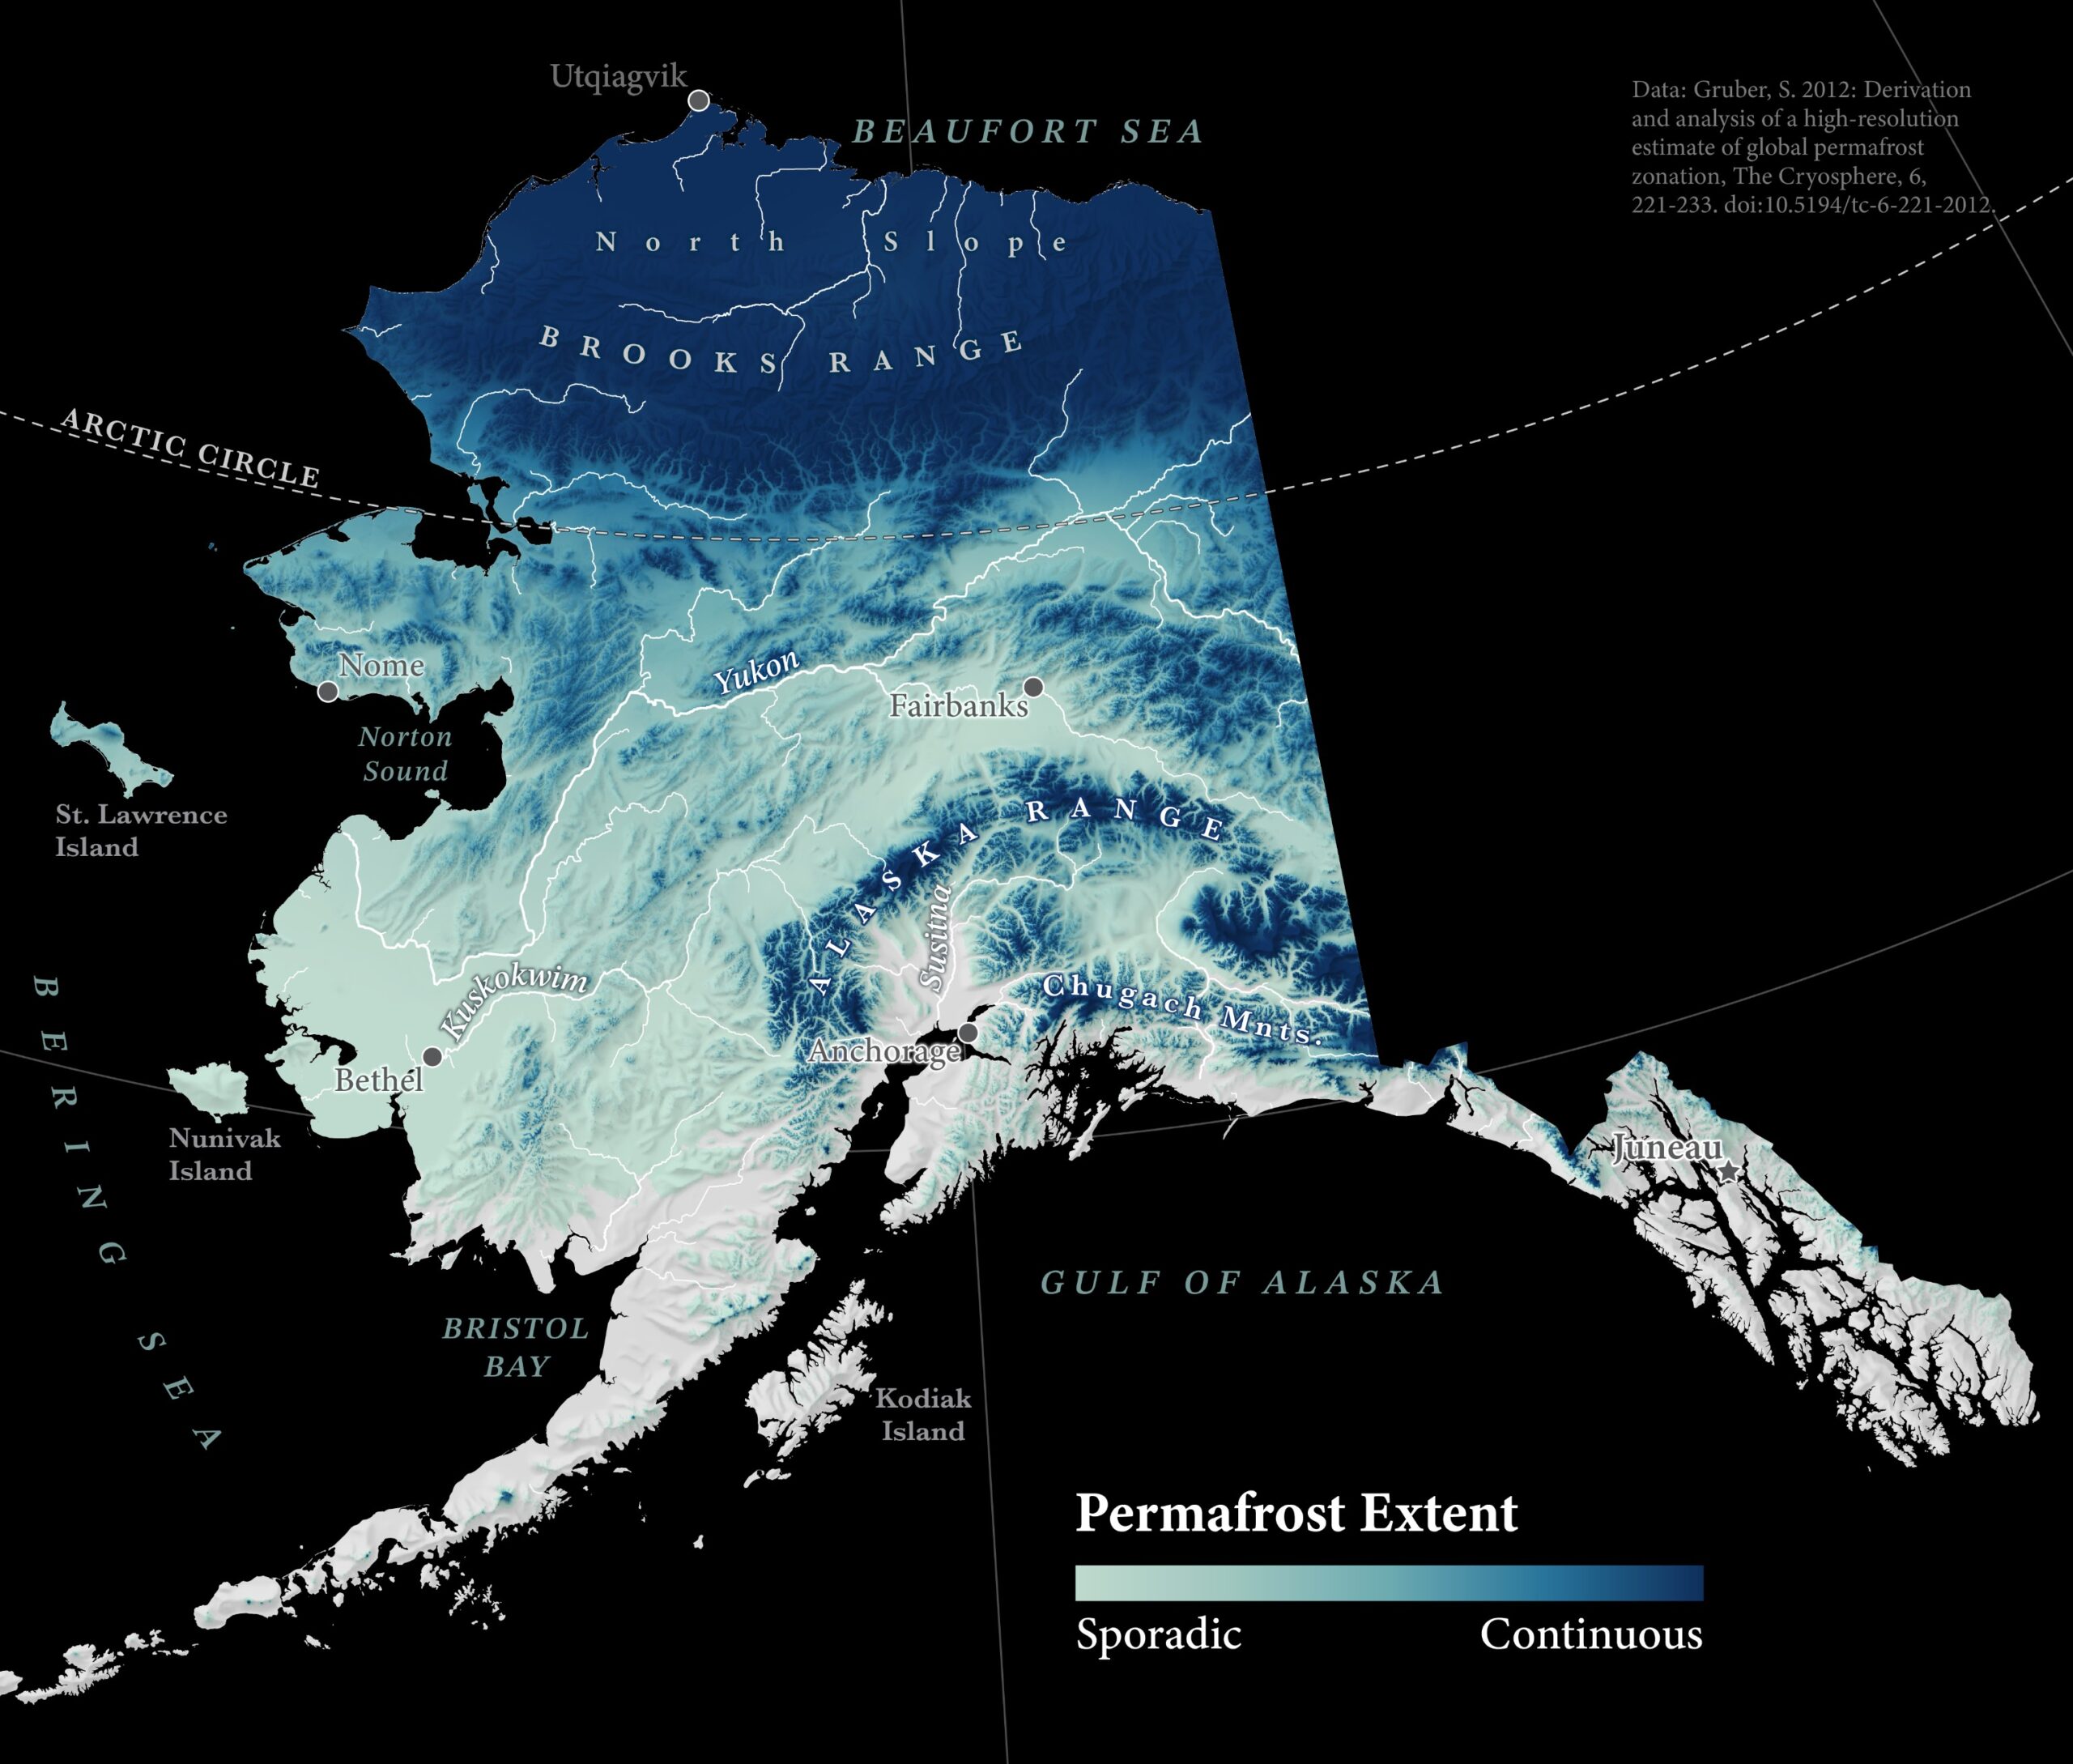
8. Current permafrost extent in Alaska
80% of Alaskan lands are within the permafrost region. Pan-Arctic warming is causing permafrost to thaw, destabilizing the ground, and contributing to flooding and erosion. Slow-onset processes like coastal and riverine erosion, and extreme weather events like storms, floods, and wildfires can accelerate permafrost thaw and contribute to usteq—the Yup’ik word for catastrophic ground collapse.
Map by Christina Shintani / Woodwell Climate Research Center
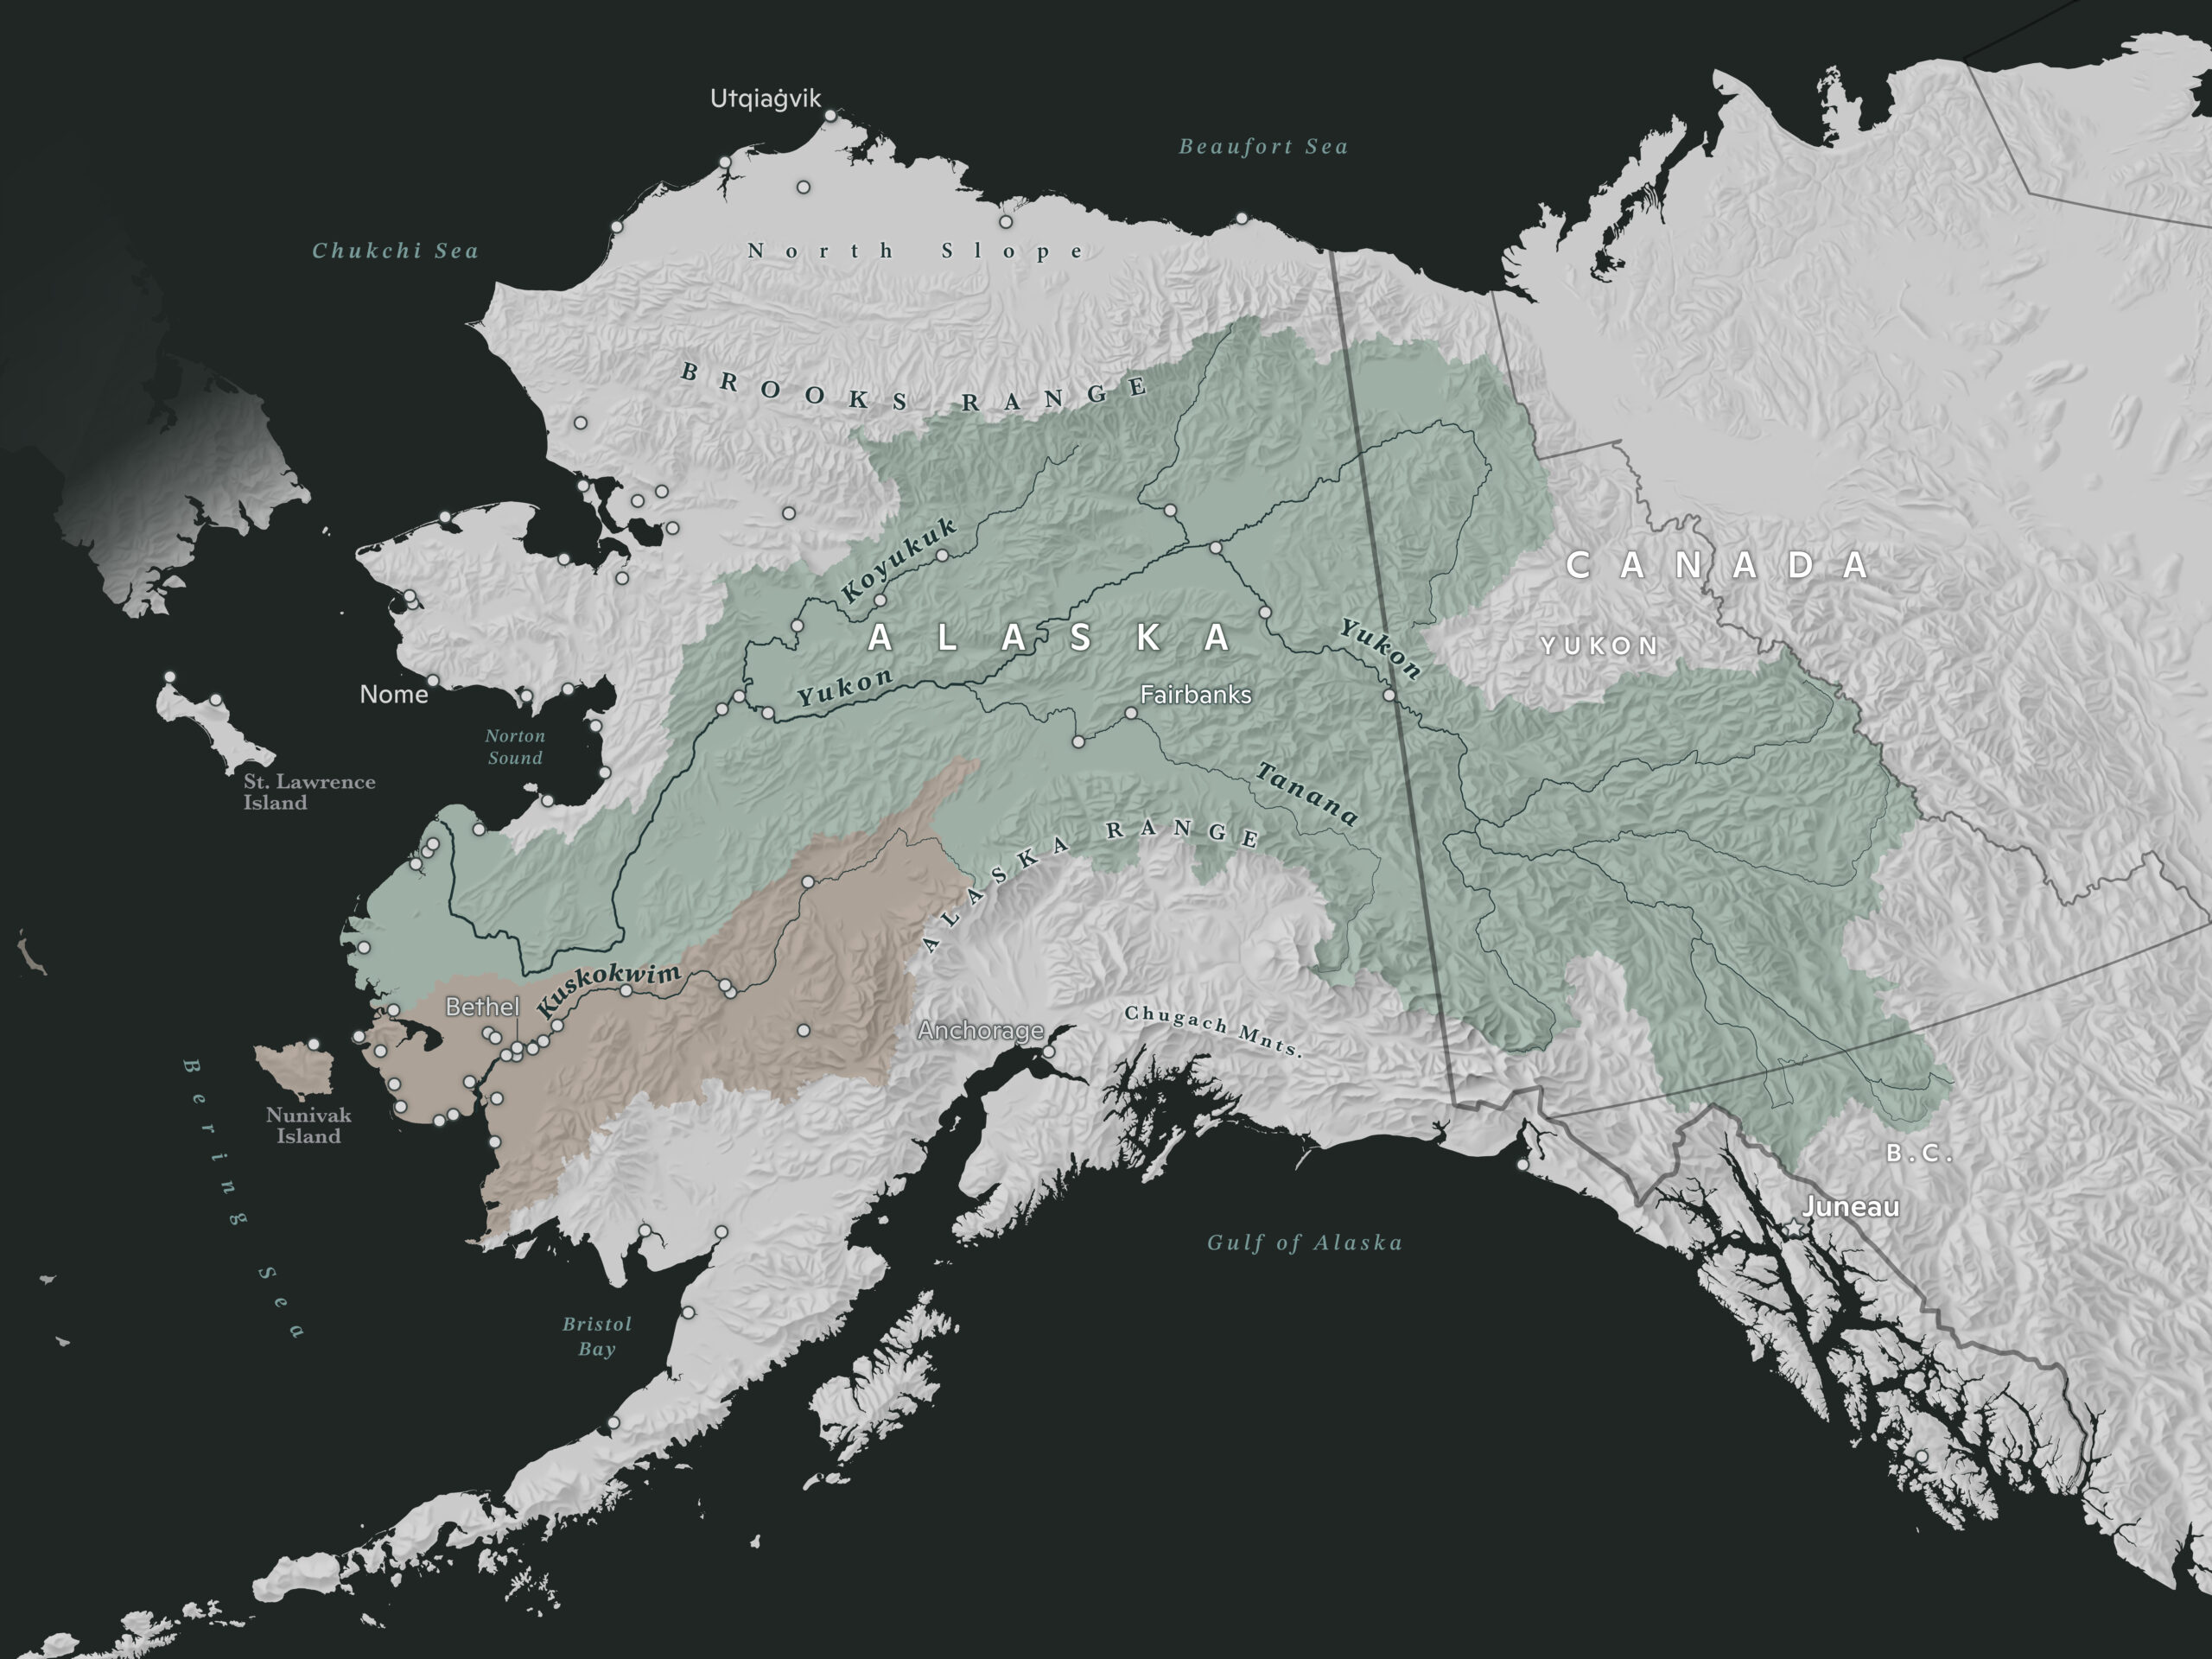
9. Yukon and Kuskokwim River watersheds
Multiple salmon species face unprecedented ecological and management threats in a rapidly changing Arctic. Salmon decline in Alaska is threatening the cultural, spiritual, and emotional health of Alaska Native communities who have stewarded these lands and waters for 10,000 years.
This map, which shows the Yukon (green) and Kuskowim (brown) River watersheds was created as part of a special StoryMap project by Permafrost Pathways and Native Movement. The StoryMap resource takes you on a journey through the impacts that climate change is having on salmon in the Yukon and Kuskokwim River watersheds, the need for Alaska Native-led management solutions, and how you can help to support sustainable Indigenous-led fisheries governance in Alaska.
Map by Christina Shintani / Woodwell Climate Research Center
10. Soil organic carbon in Alaska
This map represents the organic carbon locked in Alaskan soils. Thawing carbon-rich permafrost is an important contributor to climate change that is currently not well represented in global climate models. Regional soil carbon mapping like this helps to inform global carbon budgeting and monitoring, as well as community adaptation decision-making. (Data source)

Map by Christina Shintani / Woodwell Climate Research Center
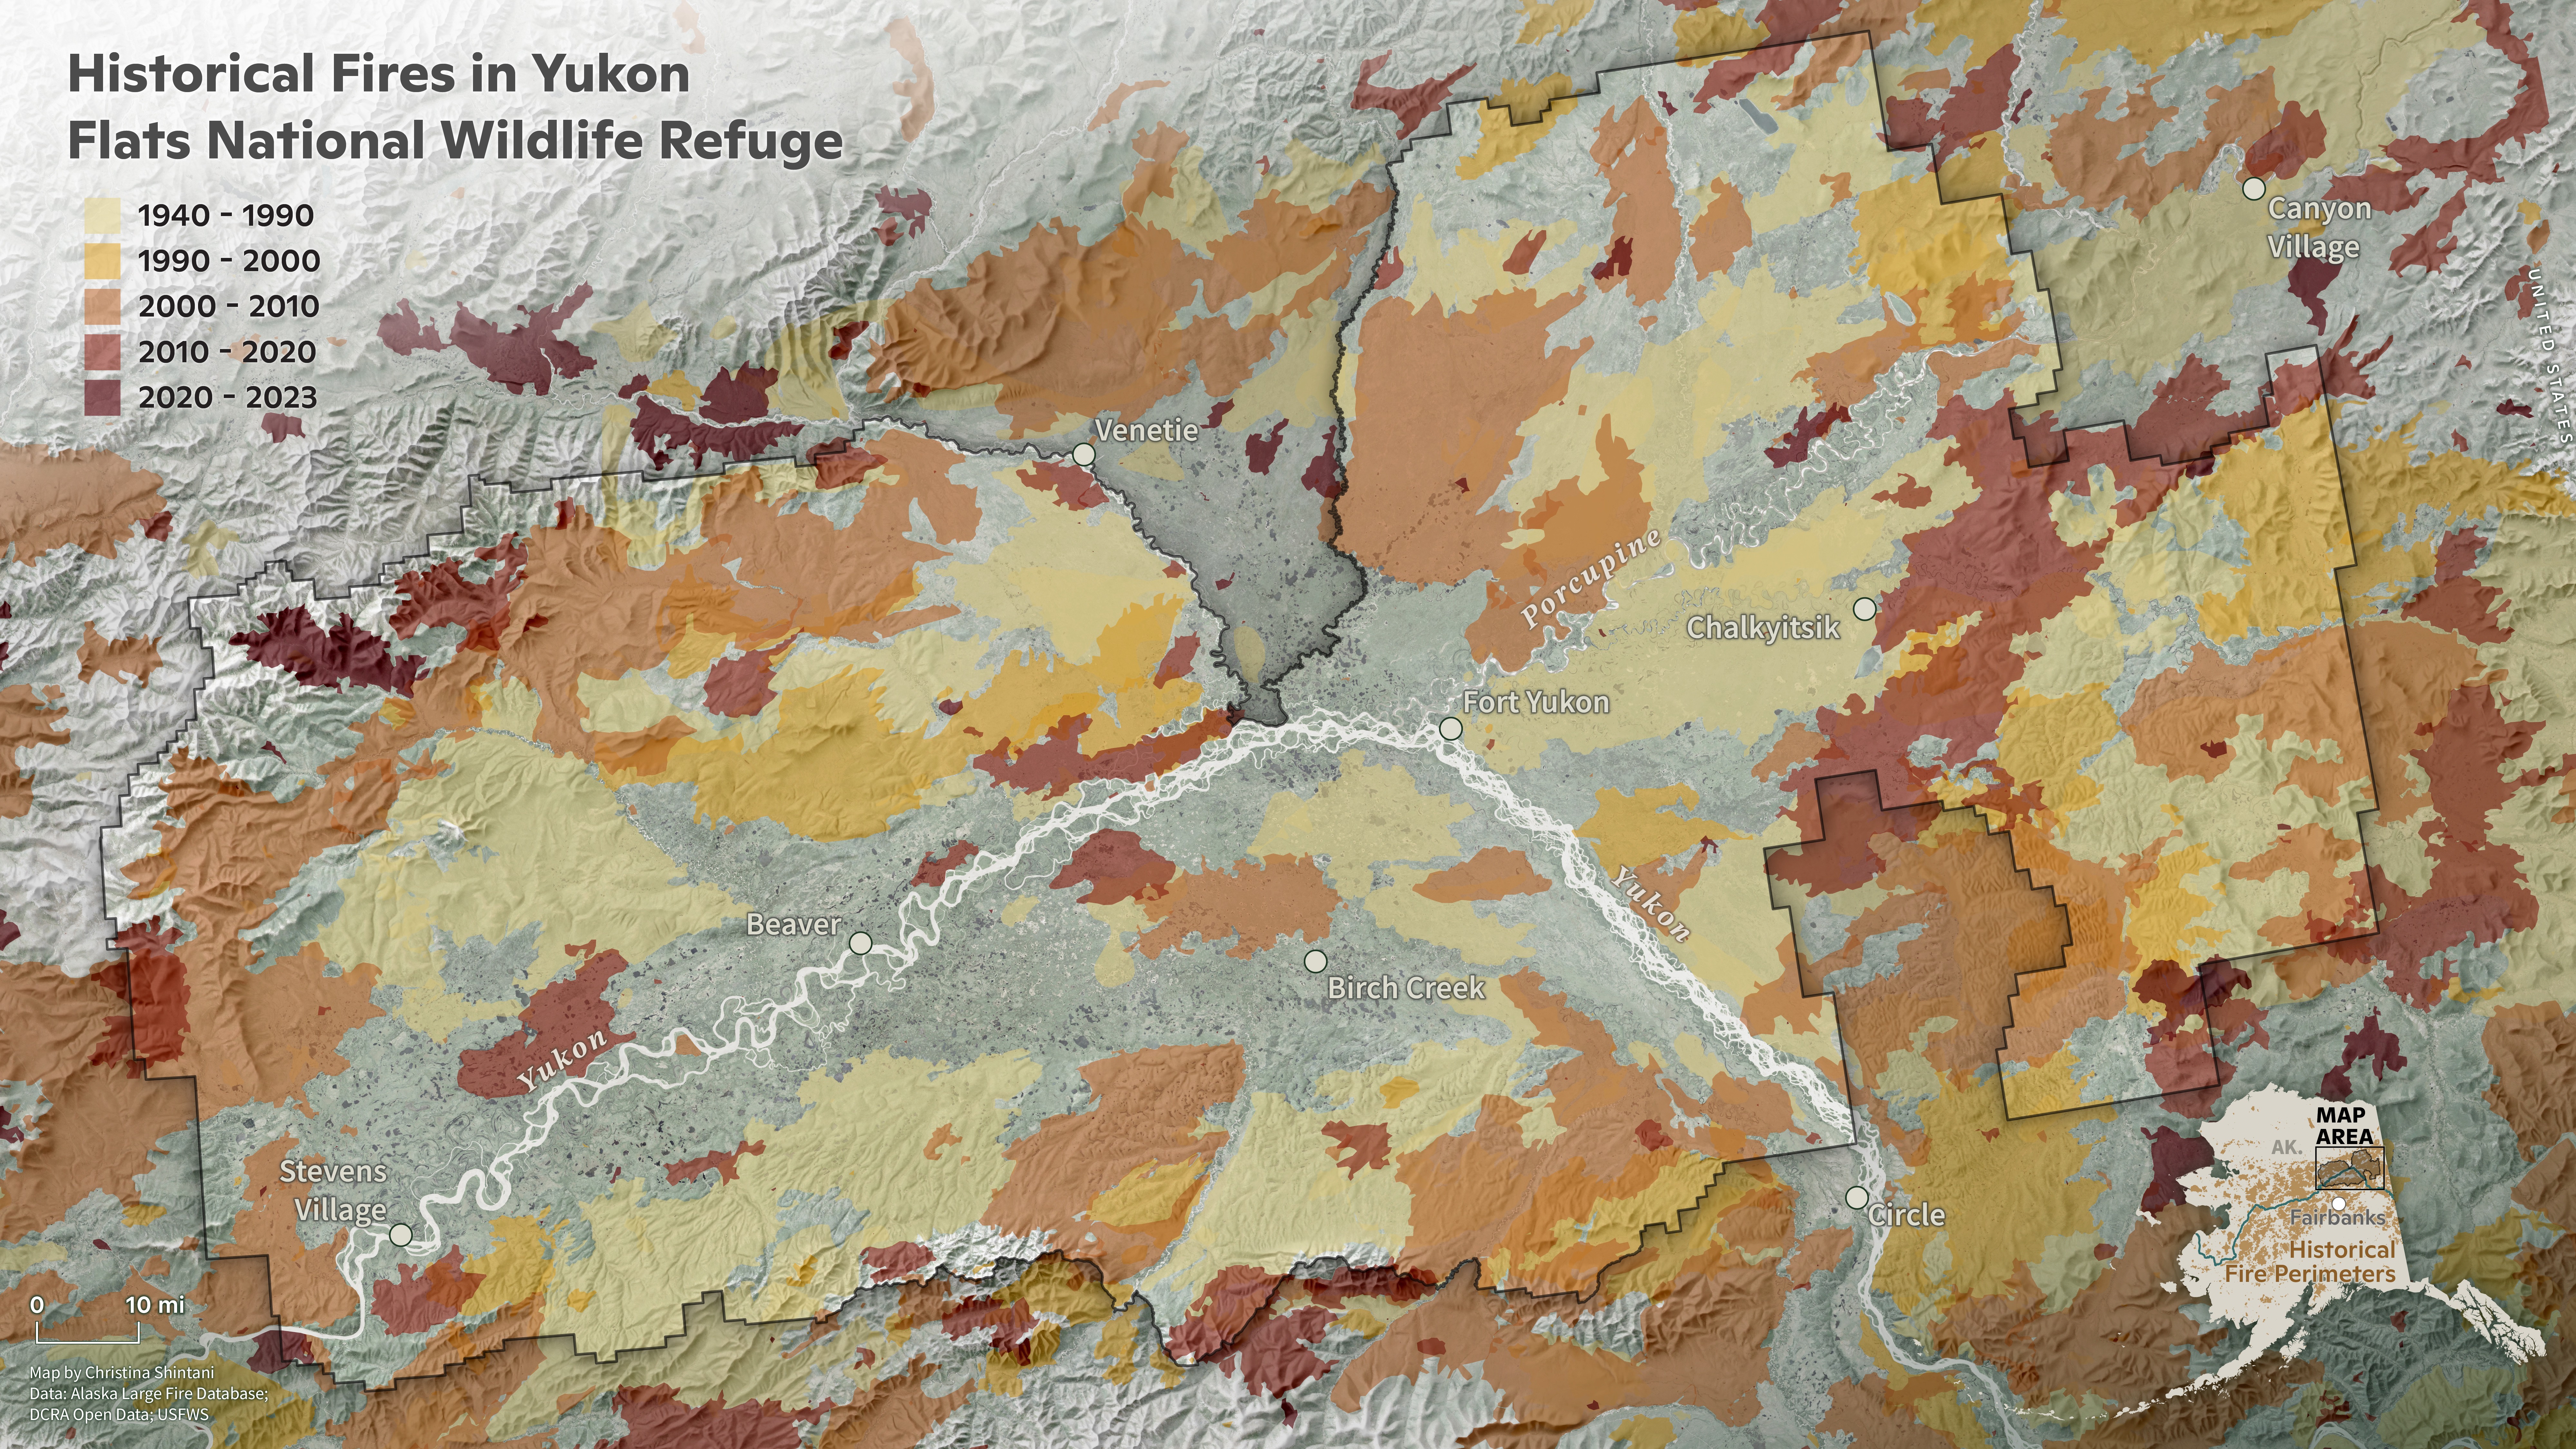
11. Historical fires in Yukon Flats National Wildlife Refuge
Historical fire activity in the Yukon Flats National Wildlife Refuge from 1940-2023.
Map by Christina Shintani / Woodwell Climate Research Center
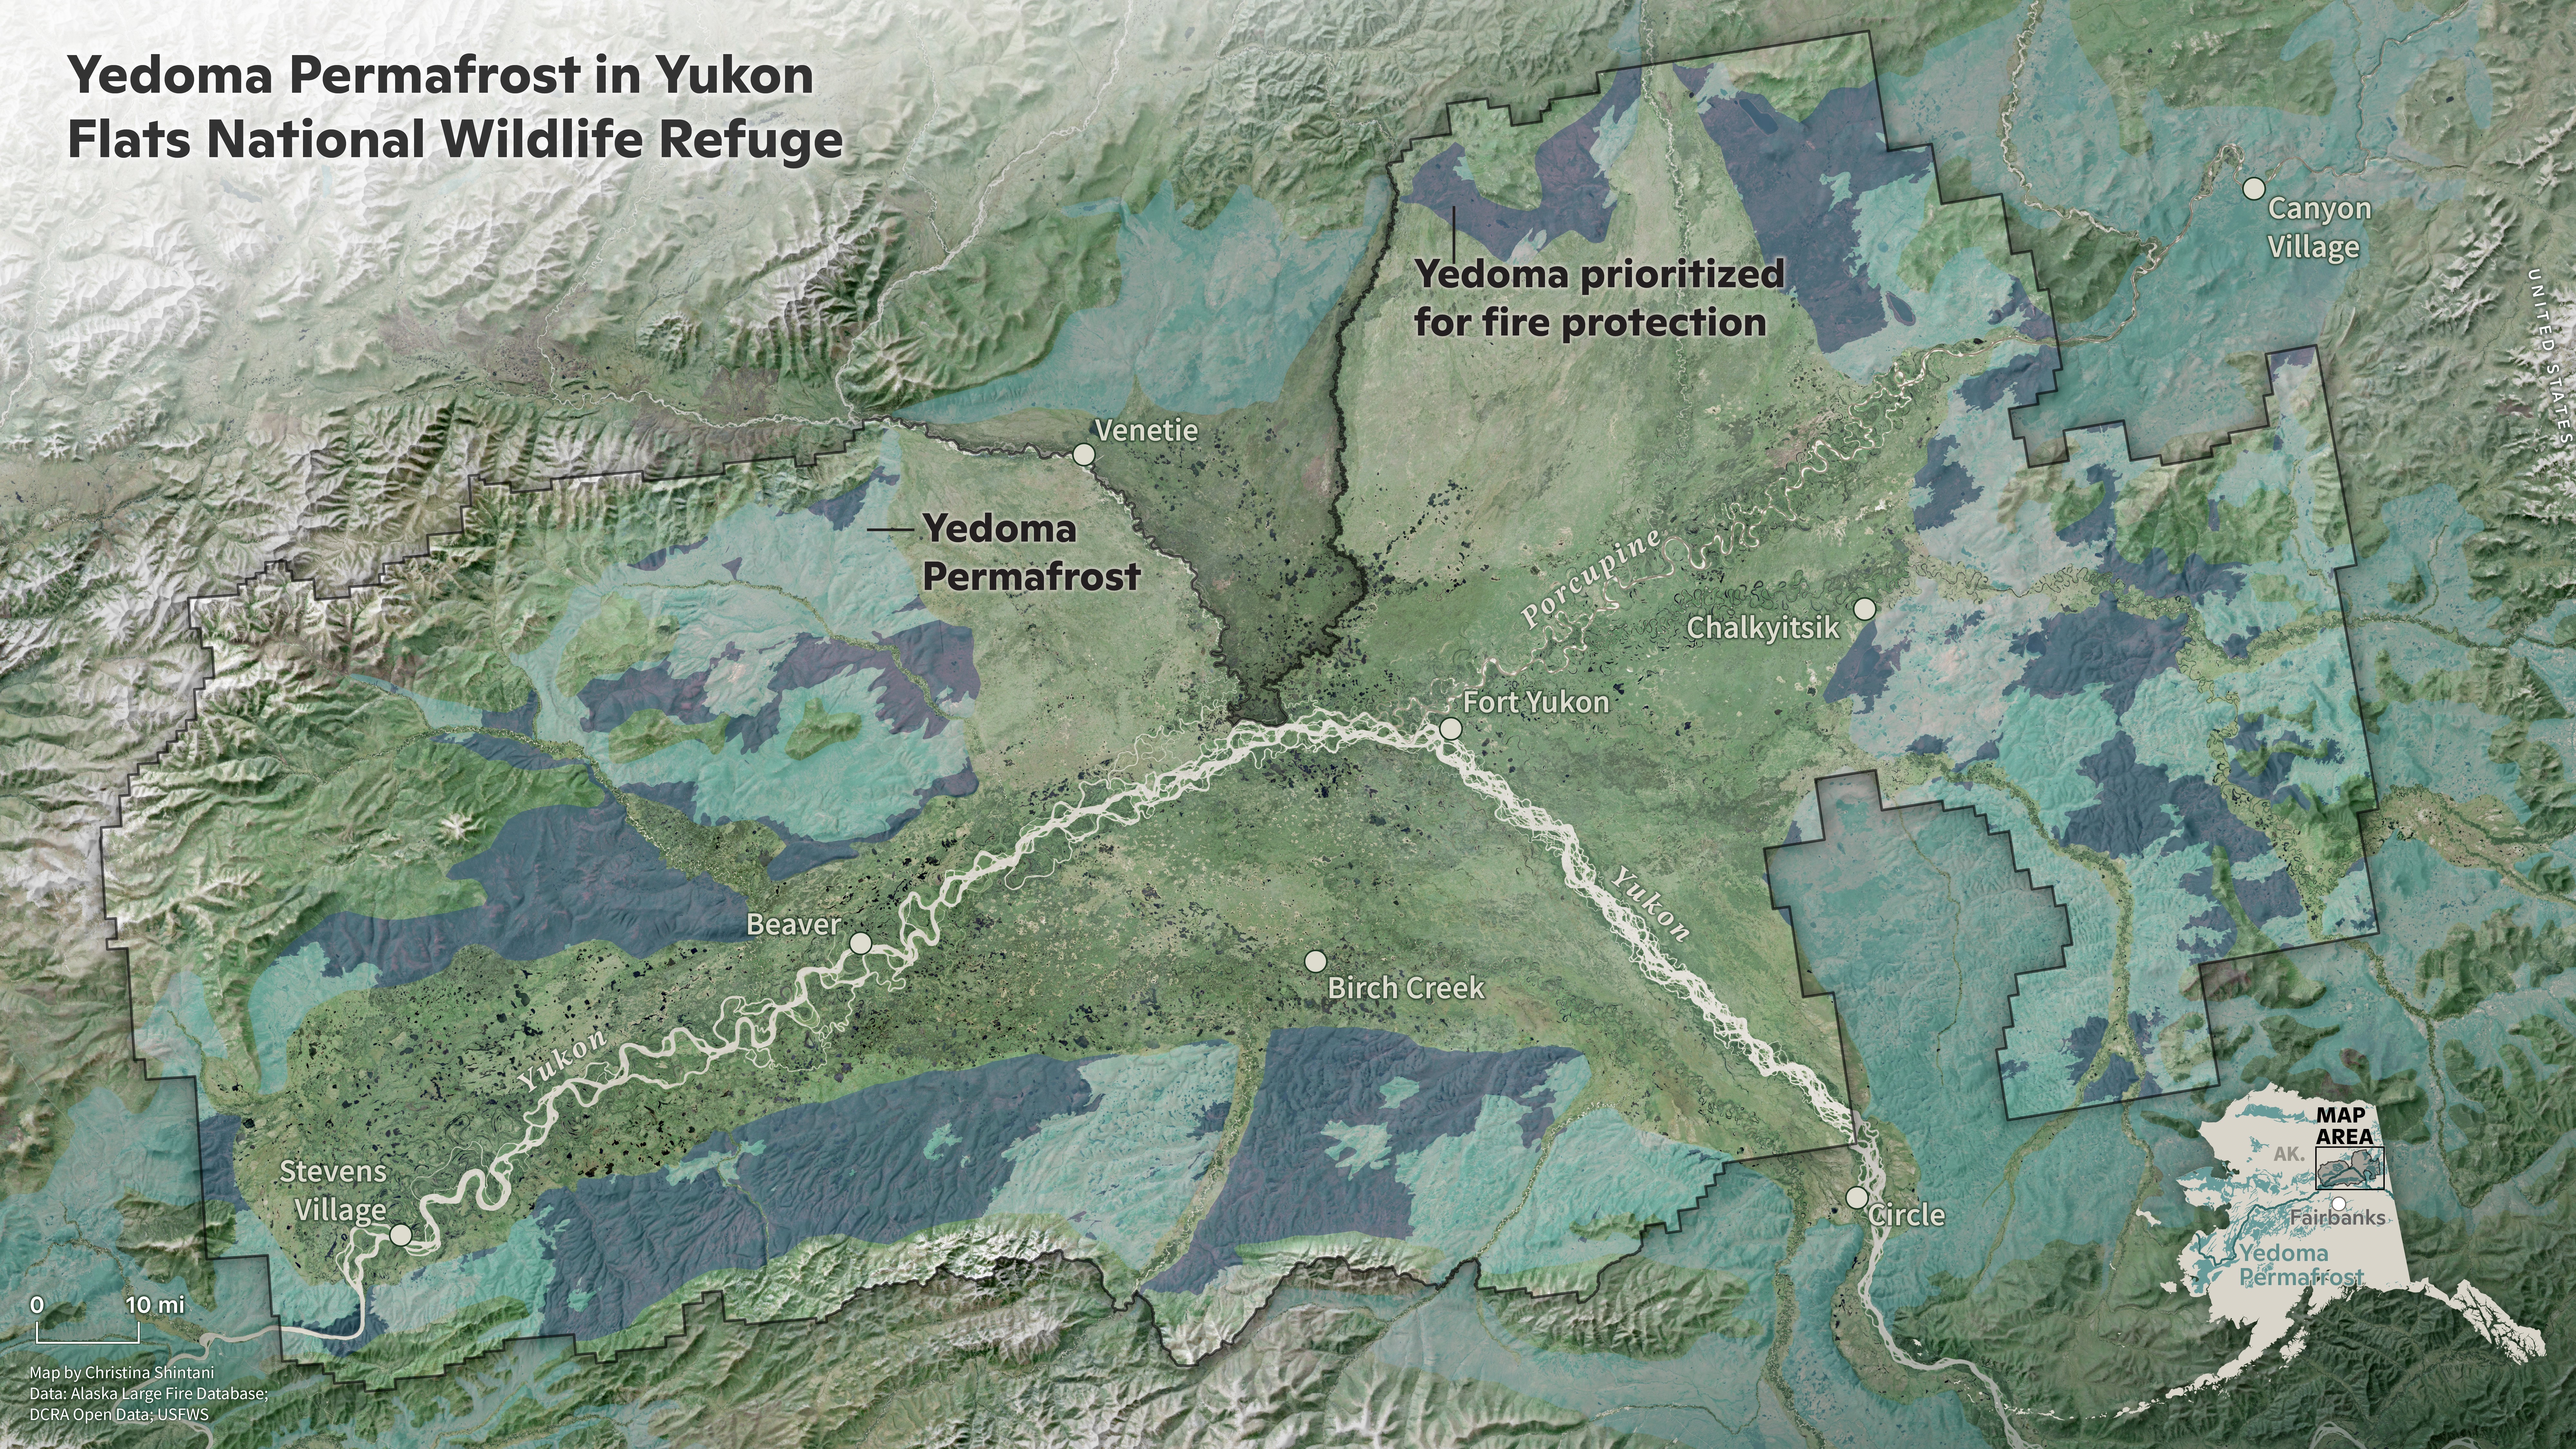
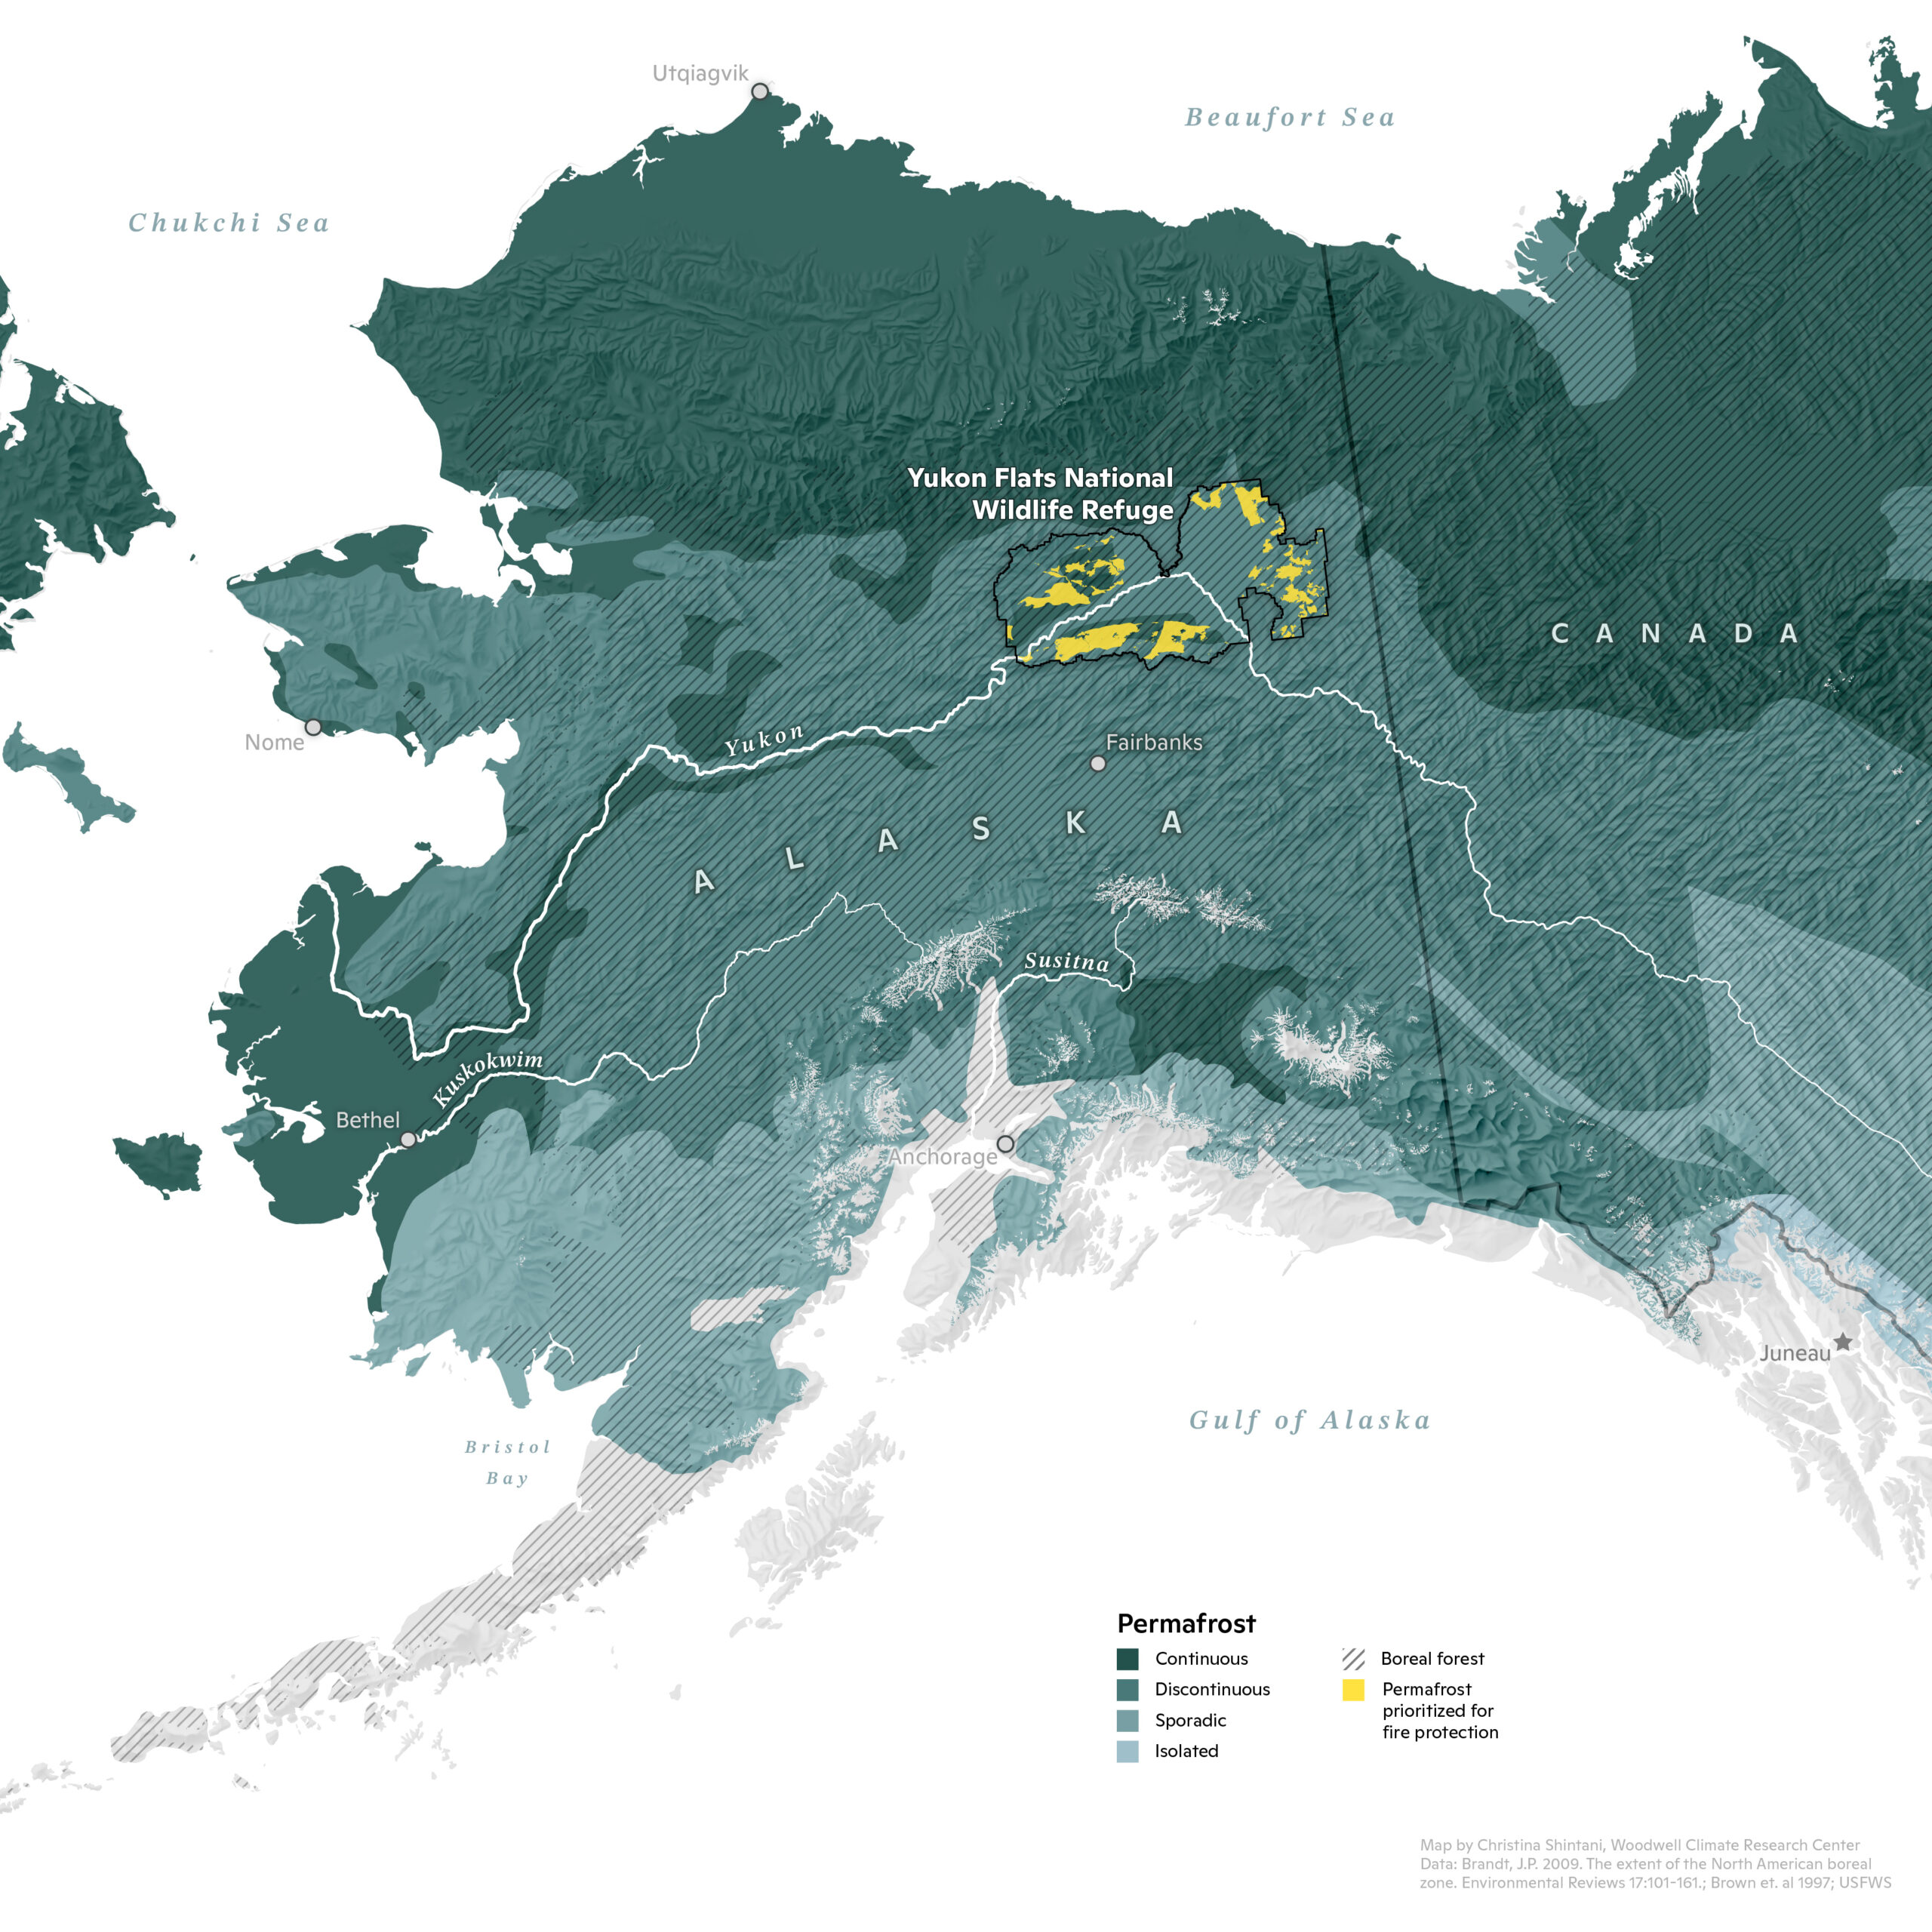
12 + 13. Protecting Yedoma permafrost in the Yukon Flats National Wildlife Refuge
In January 2023, as a direct response to research and collaboration with researchers from Permafrost Pathways and Woodwell Climate Research Center, the U.S. Fish and Wildlife Service enhanced the fire suppression status of 1.6 million acres of Yedoma permafrost-rich land on the Yukon Flats National Wildlife Refuge. The decision was made in consultation with the Alaska Fire Service and Indigenous communities within the refuge.
Maps by Christina Shintani / Woodwell Climate Research Center
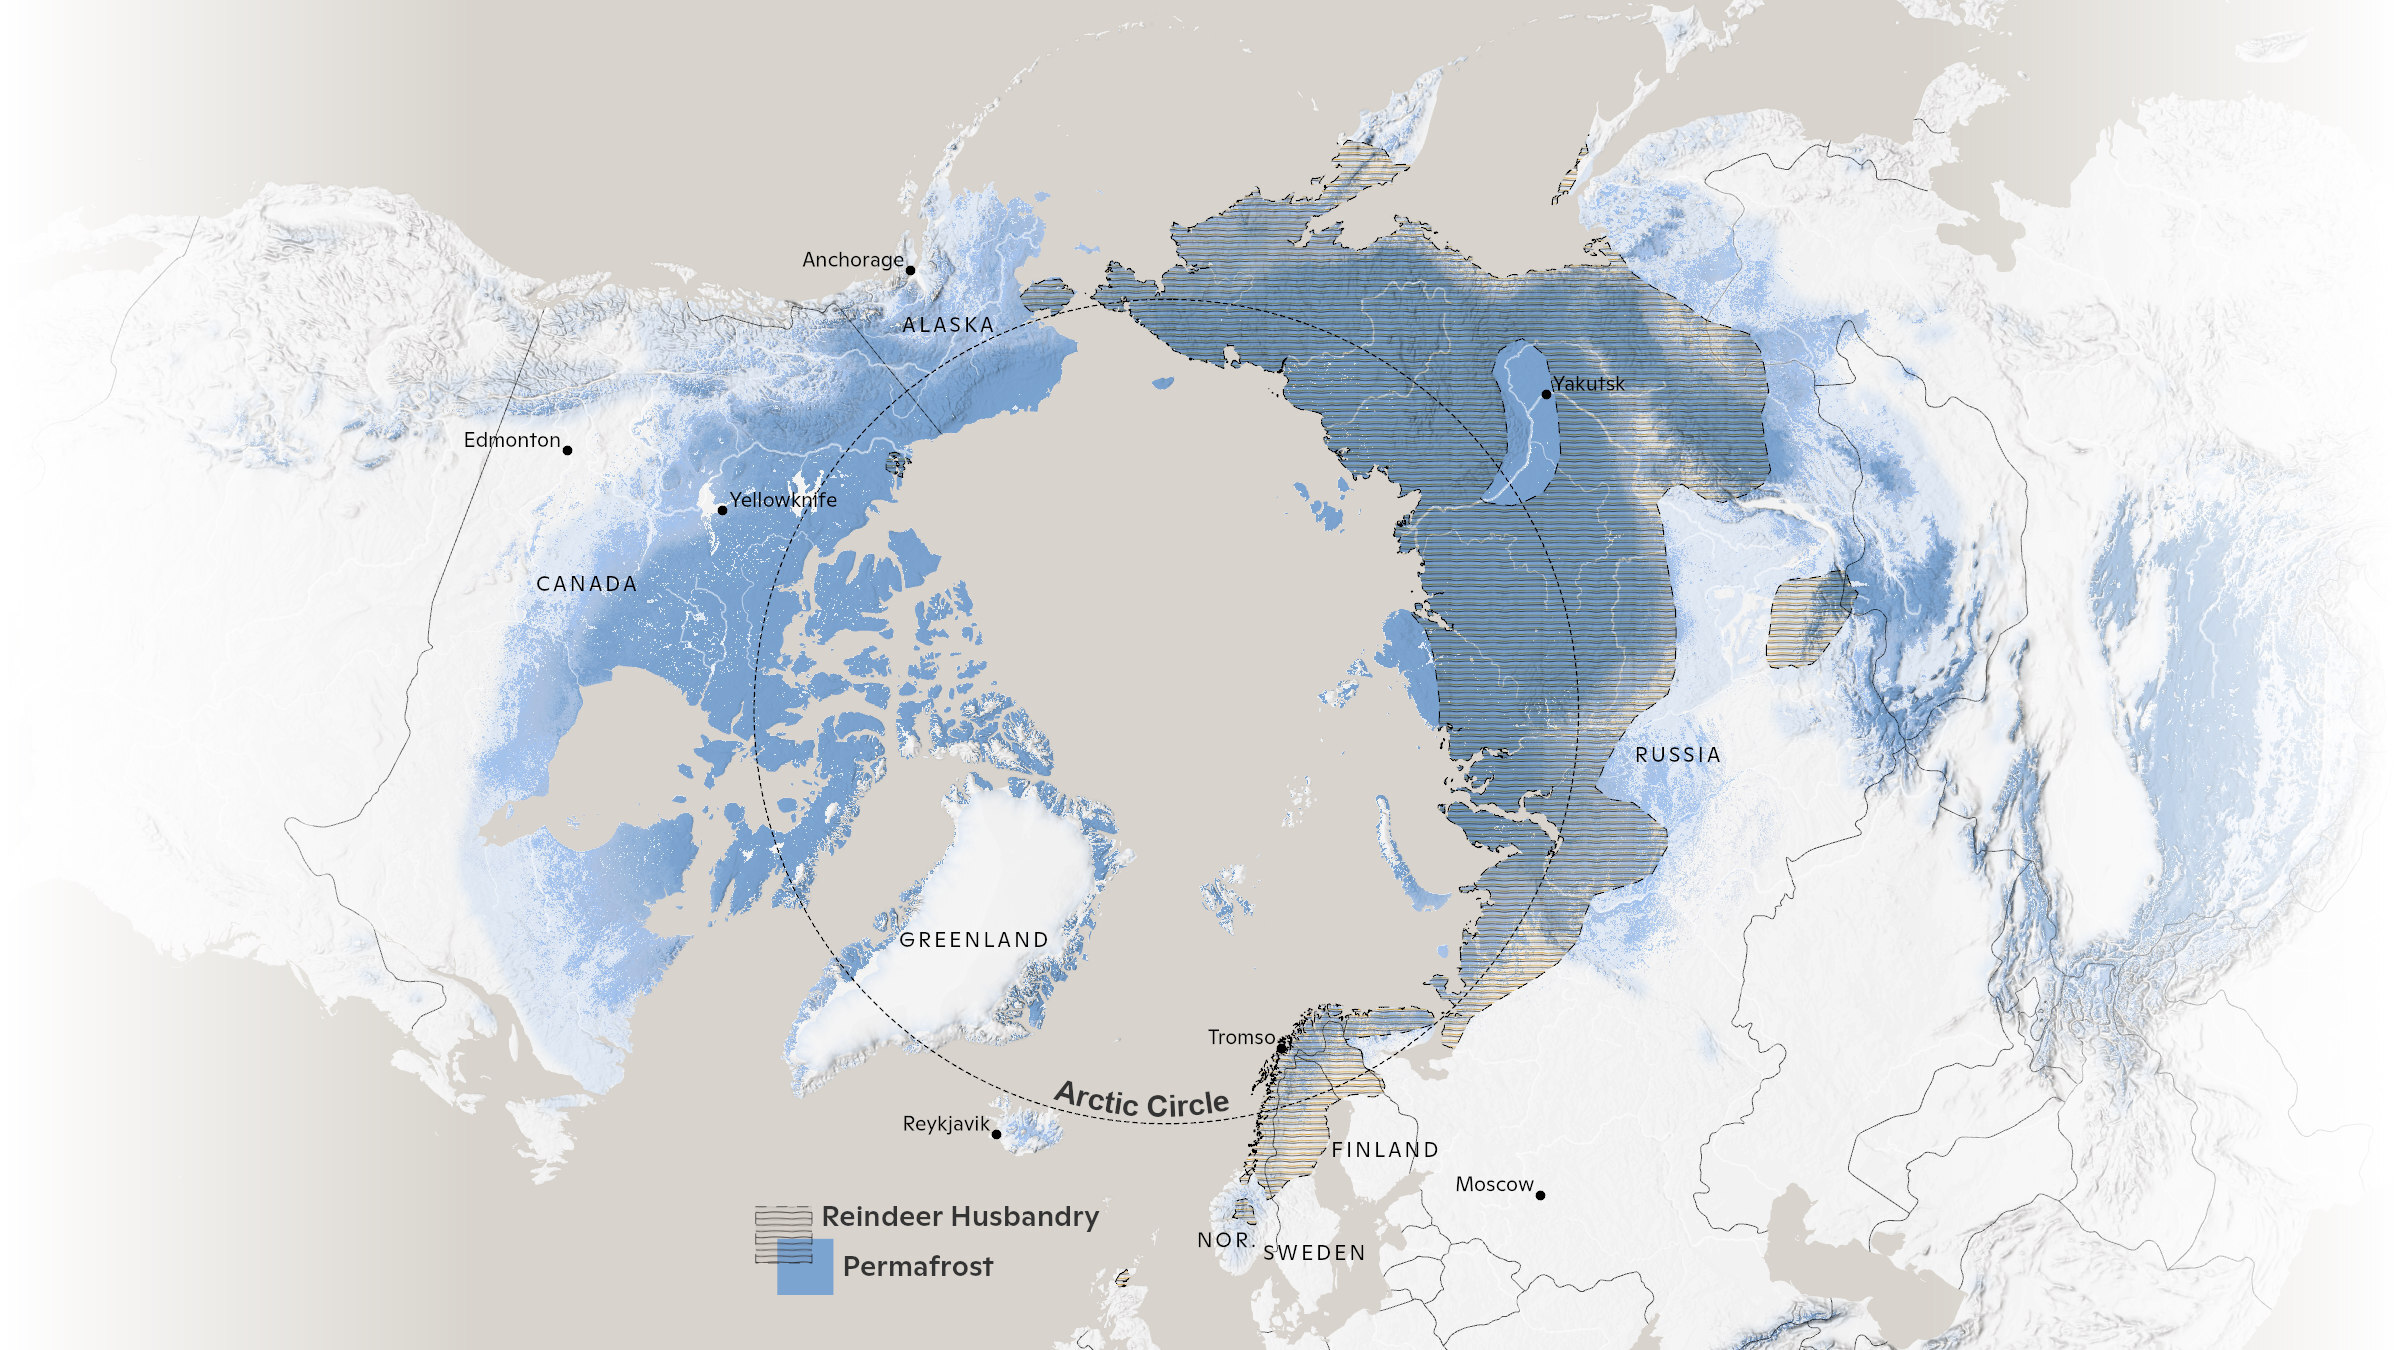
14. Reindeer husbandry and permafrost
Reindeer husbandry lands span much of the permafrost region across Eurasia. Today, about 100,000 people across nine countries participate in reindeer herding with about 2.5 million semi-domesticated reindeer. Reindeer herding peoples, such as the Sámi, have practiced subsistence ways of living across the Arctic region since time immemorial. The intimate relationship between reindeer and Sámi people is ancient, and their health, well-being, and futures are mutually dependent on one another.
Map by Greg Fiske / Woodwell Climate Research Center
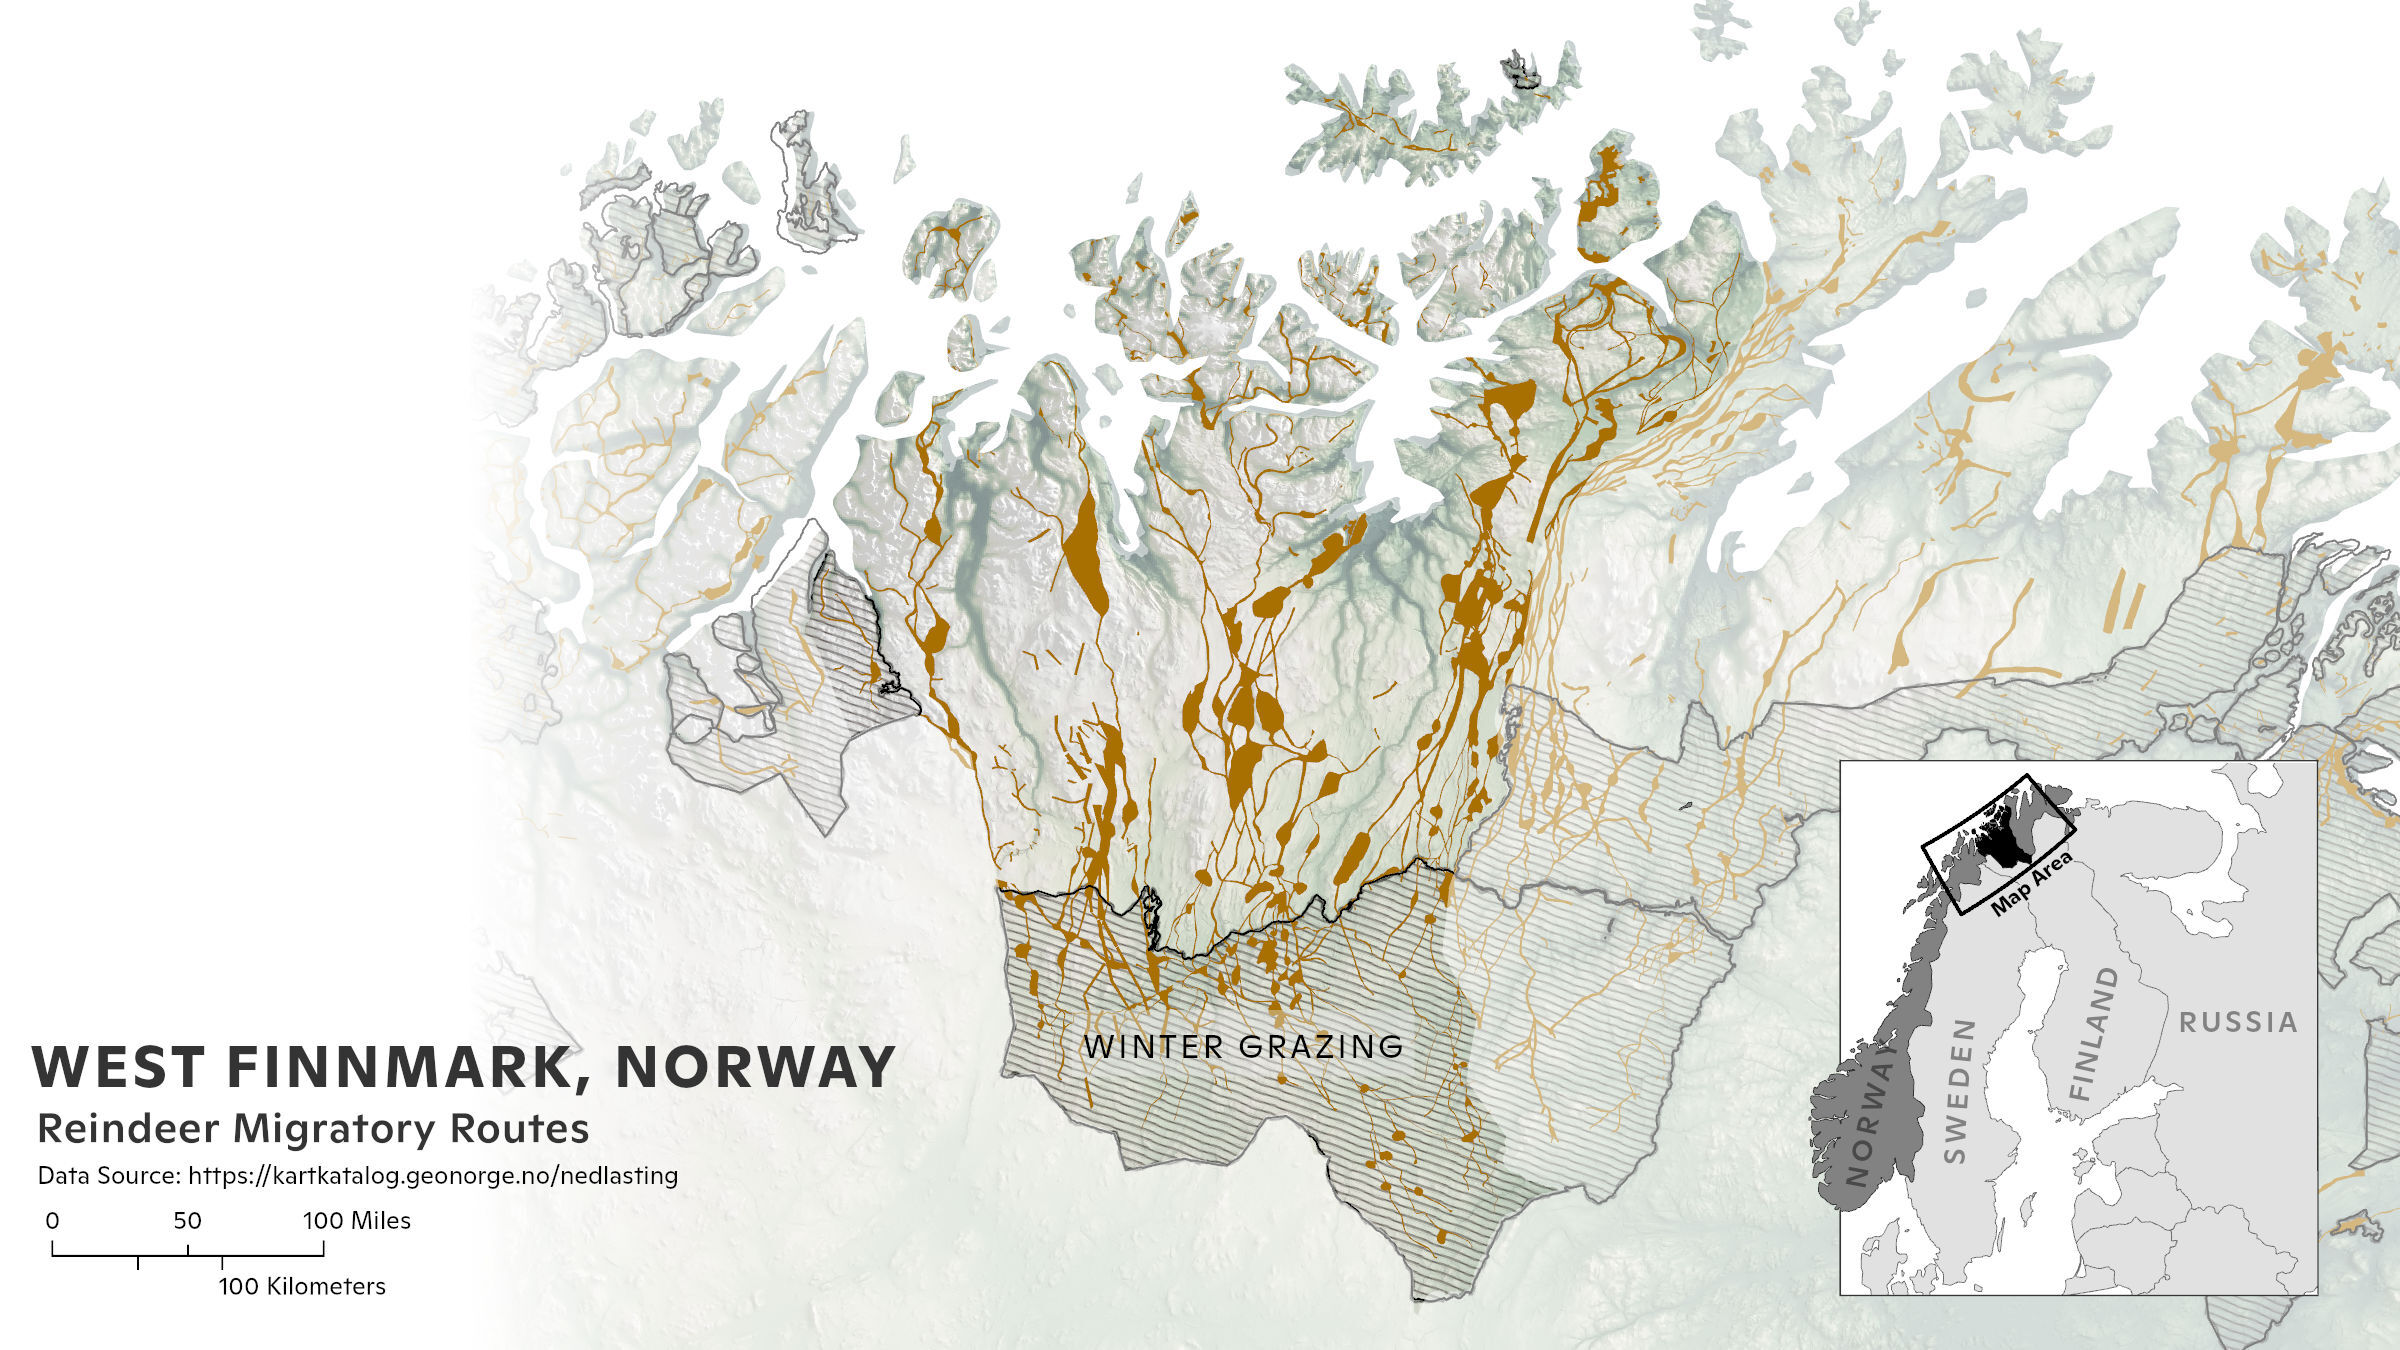
15. Reindeer migratory routes
Reindeer and Sámi reindeer herders face profound challenges as they grapple with pasture loss, the intrusion of extractive industries, and the impacts of Arctic climate change such as permafrost thaw and land degradation which affect migratory routes. Sámi who practice reindeer husbandry are forced to adapt to these threats while trying to maintain their traditional lifeways in the Arctic.
Map by Greg Fiske / Woodwell Climate Research Center
Want more Arctic maps?
Stay tuned for more maps and graphics by checking out our new Permafrost Pathways resources hub.
Get Permafrost Pathways news directly to your inbox by signing up for our email updates. Stay connected by following us on Instagram, Twitter, and Bluesky or by exploring our updates page and resource hub.
Receive updates about Woodwell Climate’s Arctic program by subscribing here. You can also follow Woodwell Climate on Instagram, Bluesky, Facebook, and LinkedIn.
Go to top

