Using machine learning to detect a major greenhouse gas-emitting climate hazard
- Features
An abrupt permafrost thaw event in northwestern Canada. These thaw slumps rapidly mobilize permafrost carbon and can generate high methane emissions. Photo by Scott Zolkos / Woodwell Climate Research Center.
Permafrost Pathways is contributing to the advancement of mapping techniques used to predict abrupt permafrost thaw
Covering 15 percent of the northern hemisphere, permafrost is perennially frozen ground that underlies the Arctic tundra and large swaths of boreal forest. As the Arctic continues to warm faster than the rest of the planet, this carbon-rich permafrost is thawing—devastating Arctic communities and triggering a powerful greenhouse gas-emitting feedback loop with global consequences. When permafrost that contains a lot of ice begins to thaw, it causes dramatic and abrupt ground collapse. Known as abrupt thaw, this process has the potential to double the impact that thawing permafrost will have on the climate. But the implications of abrupt thaw are not currently included in climate trajectories or estimates of remaining carbon budgets to stay within global temperature thresholds set to avoid the worst impacts of climate change.
Thaw slump in the Northwest Territories, Canada. Photo by Scott Zolkos / Woodwell Climate Research Center.
A major limitation to accounting for abrupt thaw is the lack of spatial data tools, such as maps, that help scientists identify where thaw features are happening across the permafrost region. Retrogressive thaw slumps (RTS) are a type of abrupt thaw feature that cause landslides and erosion and have the power to alter coastlines and large swaths of terrain. Historically, because of the relatively small size of these features, detecting RTS has been limited to small geographic areas. However, advancements in Artificial Intelligence (AI), machine learning, and high-resolution satellite imagery are changing that.
Model prediction of a retrogressive thaw slump in Banks Island, Canada. Image by Greg Fiske / Woodwell Climate Research Center.
Improving RTS mapping across the Arctic
While machine learning is not new and has been around since the mid 1900s, it is becoming increasingly popular in the world of climate science. For Permafrost Pathways and collaborators at the Alfred Wegener Institute, machine learning is being used to more accurately map abrupt permafrost thaw at a larger scale than other methods applied in the past.
“We’ve tried a couple of traditional mapping approaches—using standard GIS analysis to map hot spots of change—but none of them seem to have worked out very well. It wasn’t until we brought in the deep learning approach to mapping that we learned it was a better and a more powerful tool for this type of work,” said Woodwell Climate’s Senior Geospatial Analyst Greg Fiske. Deep learning is a subset of machine learning that uses a brain-like computing model which requires less human supervision and is proving to be a game changing method for detecting RTS.
Graphic by Jessica Howard and Yili Yang.
On the ground, RTS features—which can usually measure anywhere from 100 to 1 million-plus square meters (about a quarter of the size of New York City’s Central Park)—may appear to be massive, giving the illusion that they should be easy to observe from space. However, when you put them in the context of the nearly 5.5 million square miles of the entire Arctic region, they are in fact, quite small. Unlike wildfires which give off heat signals that are detectable by remote sensors on satellites, finding an RTS can be like searching for a needle in a haystack. An abundance of high-resolution satellite imagery and manual labels of RTS are needed for teaching materials so the models can learn what an RTS is, requiring a lot of examples and thus, a lot of data.
“The goal of machine learning is very simple. It is to teach or to enable a computer to do a task by itself,” said Woodwell Climate’s Data Scientist Specialist Dr. Yili Yang who is using AI to advance RTS mapping. “A big challenge is that we don’t have enough data. The model needs to be fed with enough examples of RTS images to establish an abstraction of RTS that accounts for its highly varied appearance across the Arctic.”
Thaw slumps in the Northwest Territories, Canada. Photo by Scott Zolkos / Woodwell Climate Research Center.
Finding RTS in satellite images and labeling them by hand is extremely time consuming. As a result, data are relatively sparse. However, it is because of the laborious and challenging data collection process that this work is also incredibly rewarding. Woodwell Climate’s Tiffany Windholz, a Research Assistant in the Arctic program, works closely with Dr. Yang to help manually digitize RTS features so the images can be used to teach the machine.
Despite the data challenges, members of the Permafrost Pathways research team developed a novel technique to detect RTS using deep learning and high-resolution satellite imagery. They built and tested their new method in smaller areas of the Yamal and Gydan Peninsulas in Siberia—a region with relatively small RTS features ranging from 100 to 25,000 square meters (about four and half football fields)—as well as several regions in northwestern Canada. They are currently applying this mapping technique to cover larger areas across the Yamal and Gydan peninsulas.
Yamal and Gydan Peninsulas in Siberia. Map by Christina Shintani / Woodwell Climate Research Center.
“A large advantage of the model we’re using is that it accounts for more surrounding information and spatial context of what you’re looking at than previous approaches that only looked at one pixel in an image at a time. It isn’t necessarily faster yet, but it is more accurate,” said Stefano Potter, a Research Associate at Woodwell Climate who also works with Dr. Yang and Windholz on RTS mapping. Using spatial context in object recognition is like solving a puzzle. Just as you need to look at neighboring puzzle pieces to understand the whole picture, the model the team is using analyzes groups of pixels together to recognize objects based on their shapes and patterns.
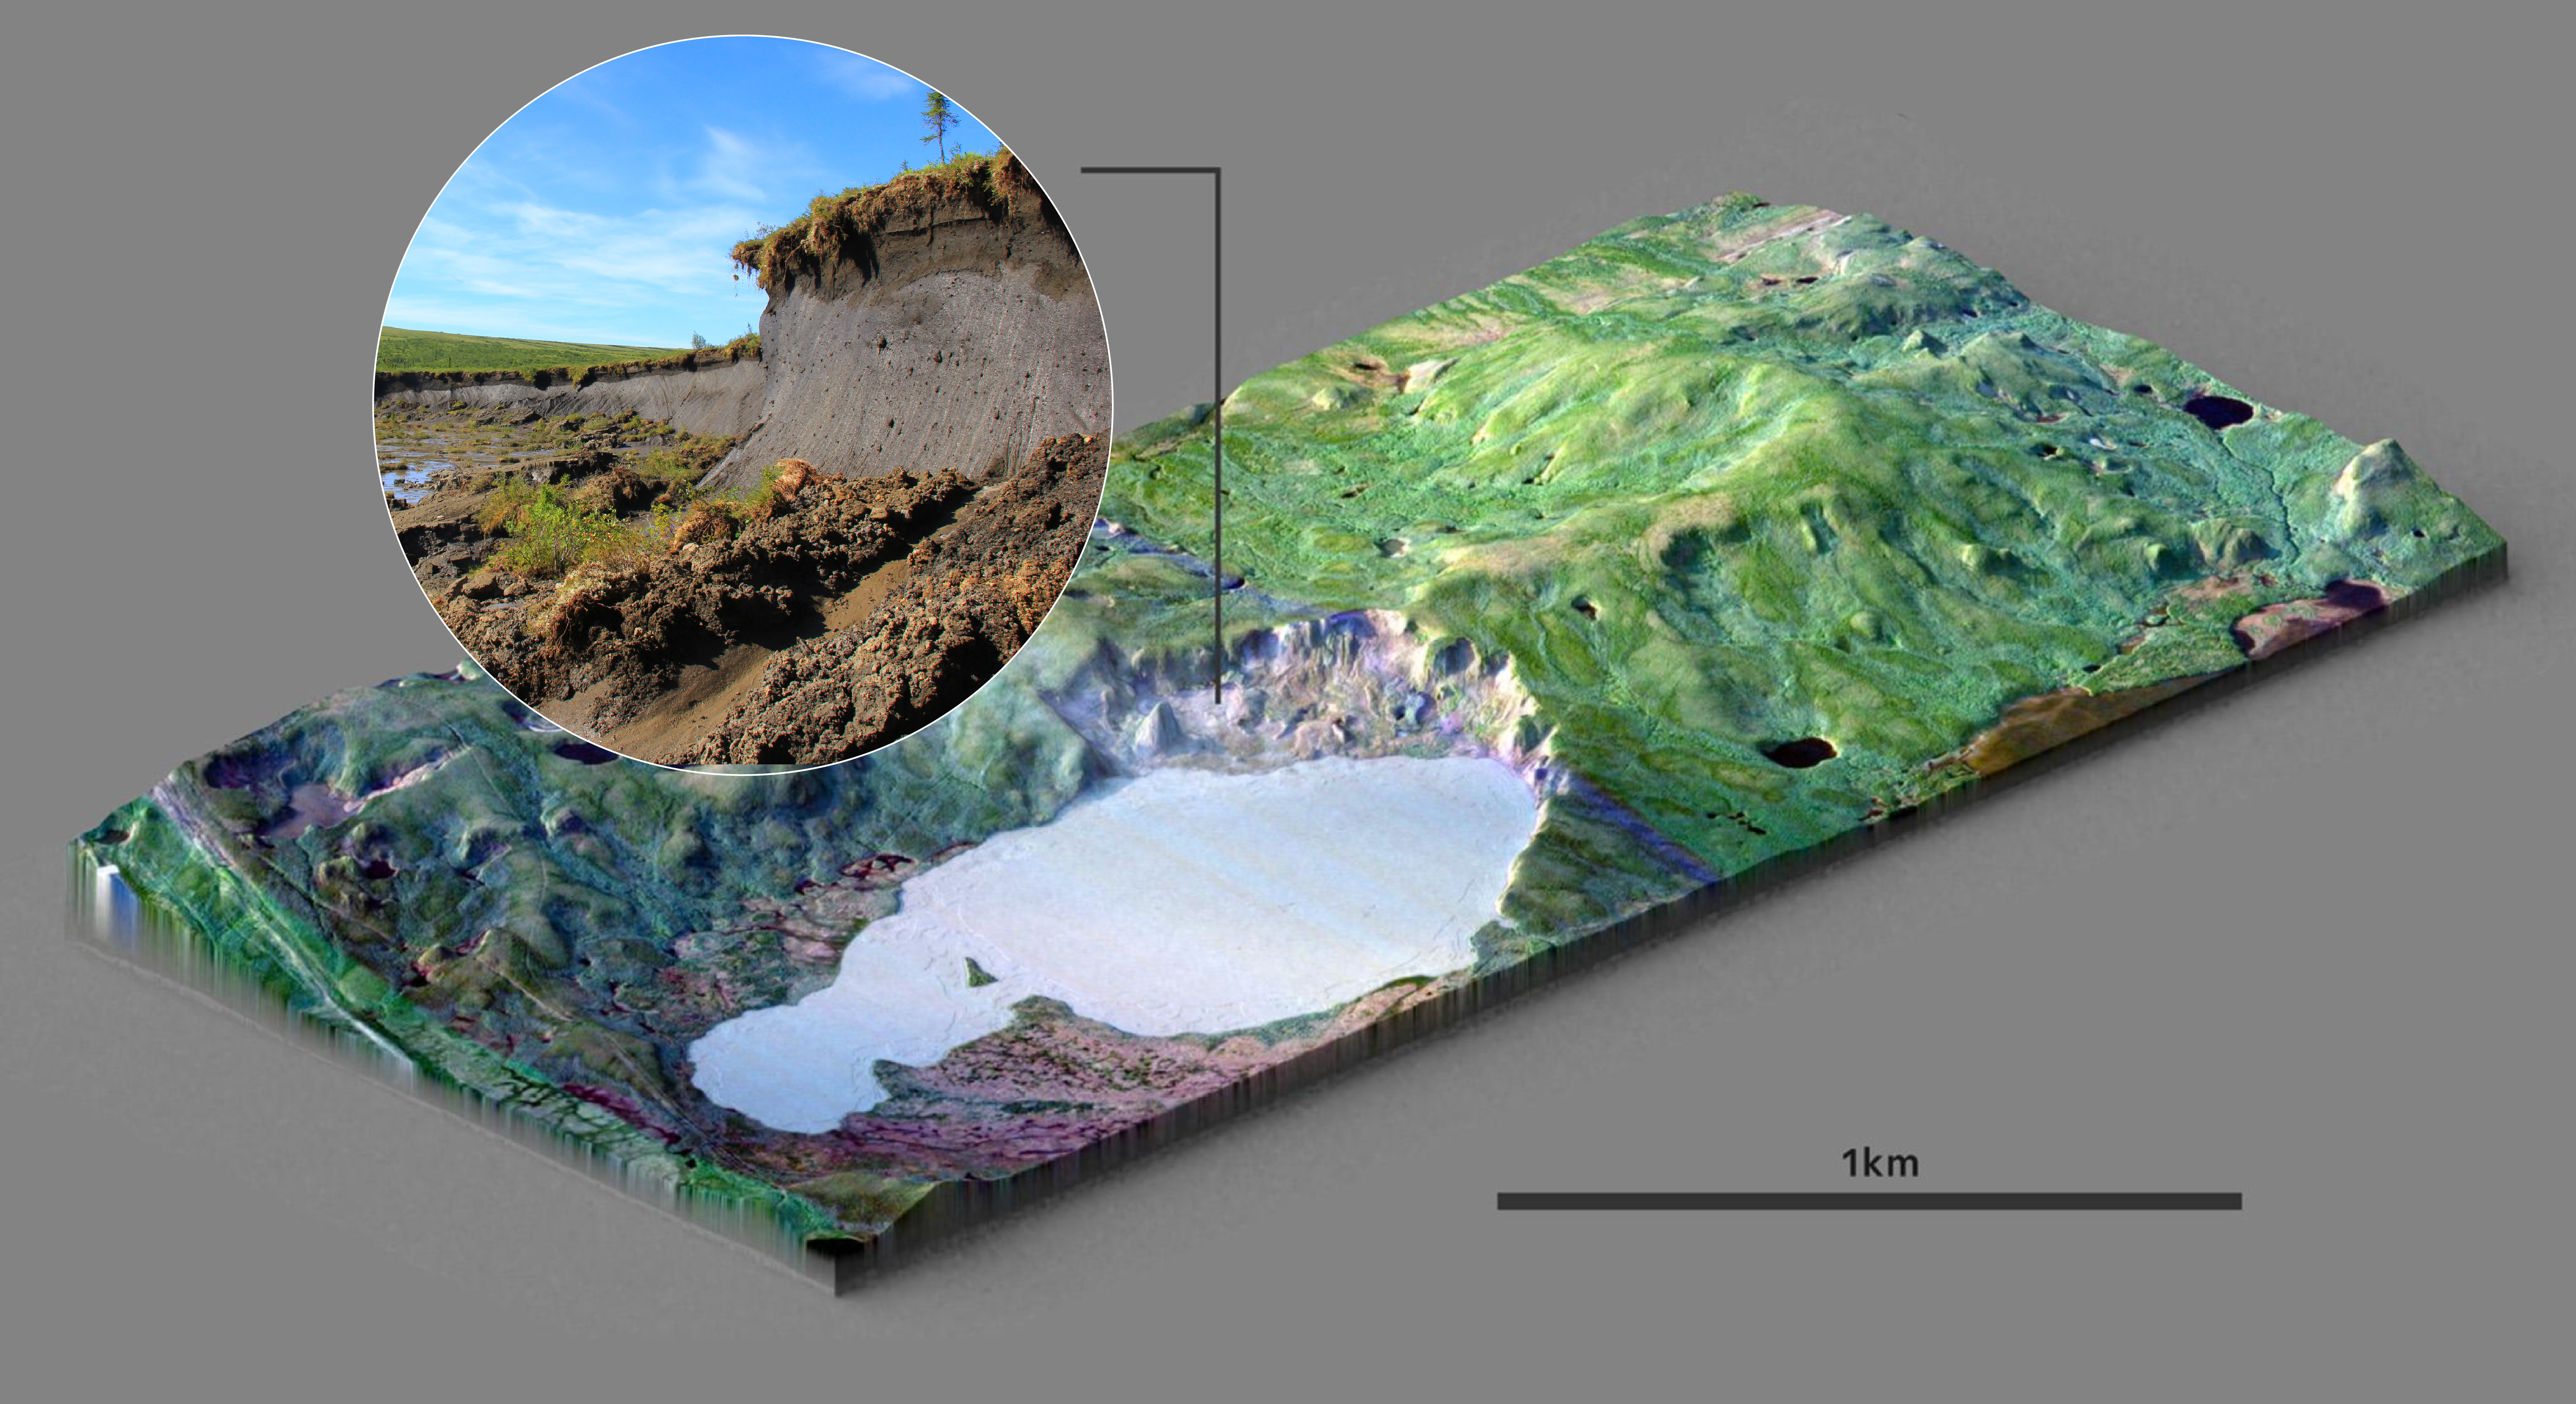
Example of an abrupt permafrost thaw feature in the Yamal Peninsula of Siberia using high-resolution satellite and topography data. Image by Greg Fiske / Woodwell Climate Research Center.
Their ultimate goal is to develop a model that can accurately map RTS features across the Arctic, assess changes in RTS size and distribution over time, and provide annual updates about this kind of landscape change—efforts that will produce critical maps for modeling the carbon implications of abrupt thaw events. Furthermore, to expand the reach and impact of this work, the information will also be shared on the Permafrost Discovery Gateway—a web-based discovery platform that houses Arctic permafrost data derived from satellite imagery and supporting analysis tools that help the user to explore and develop new knowledge. The development of the Permafrost Discovery Gateway is being led by Woodwell Climate Associate Scientist Dr. Anna Liljedahl.
“Machine learning techniques are being used by several in the Arctic science community to detect permafrost thaw features from down to the sub-meter scale to across the entire Arctic,” said Dr. Liljedahl. “So it’s important we develop analysis tools in order to discover what stories may be hidden within these big terabyte-sized datasets, tools that don’t require technical skills or any expensive software license subscription so that anyone with curiosity and with a decent internet access can be part of the discovery process.”
The best is yet to come—using machine learning to better address the climate crisis
Using machine learning and high-resolution satellite imagery to map RTS is now helping to fill gaps in permafrost data that are limiting our ability to address the climate crisis. Advancing these mapping techniques means expanding this work to capture larger areas across the Arctic that are rapidly warming with more accuracy and eventually at a faster pace than ever before.
“We are using much, much more advanced machine learning methods than those used even five or six years ago. They are becoming significantly more versatile and powerful.” Dr. Yang said.
Thaw slump at a field site in Canada’s Northwest Territories. Photo by Scott Zolkos / Woodwell Climate Research Center.
By harnessing rapid advances in machine learning and the latest climate science, we can improve the collective understanding of the local to global impacts of permafrost thaw and provide essential data to inform climate solutions. Moreover, the benefit and impact of improved RTS mapping will be felt far beyond the scientific community alone. The data and visualizations produced by these techniques are being developed with both global and local impacts in mind—with an eye on providing actionable insights to international climate policymakers as well as Arctic Indigenous communities who can use this information in combination with Indigenous Knowledge to inform climate adaptation planning. The future of this work is also aiming for a more localized approach that can provide specific and relevant information to individual communities affected by permafrost thaw.
“We are hoping to eventually develop a model to help forecast these features at a local scale in a way that would benefit the unique environmental information needs of individual communities,” said Woodwell Climate’s Associate Scientist Dr. Brendan Rogers, a co-lead of Permafrost Pathways. “Part of the plan is to then take this information and integrate it into ongoing adaptation activities already being led by Arctic Indigenous communities on the frontlines of climate change.”
Go to top