Arctic warming as elevation
- Maps
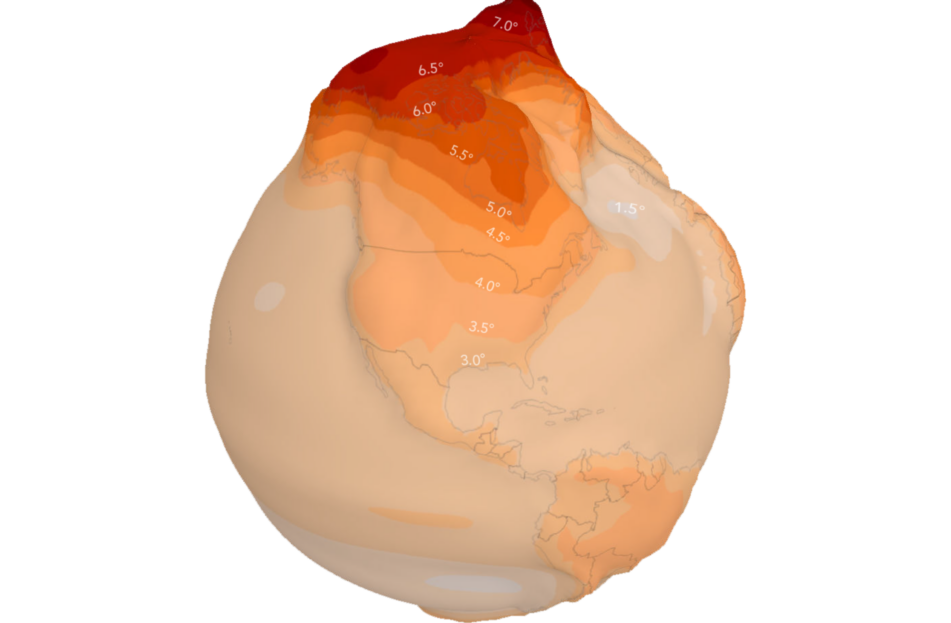
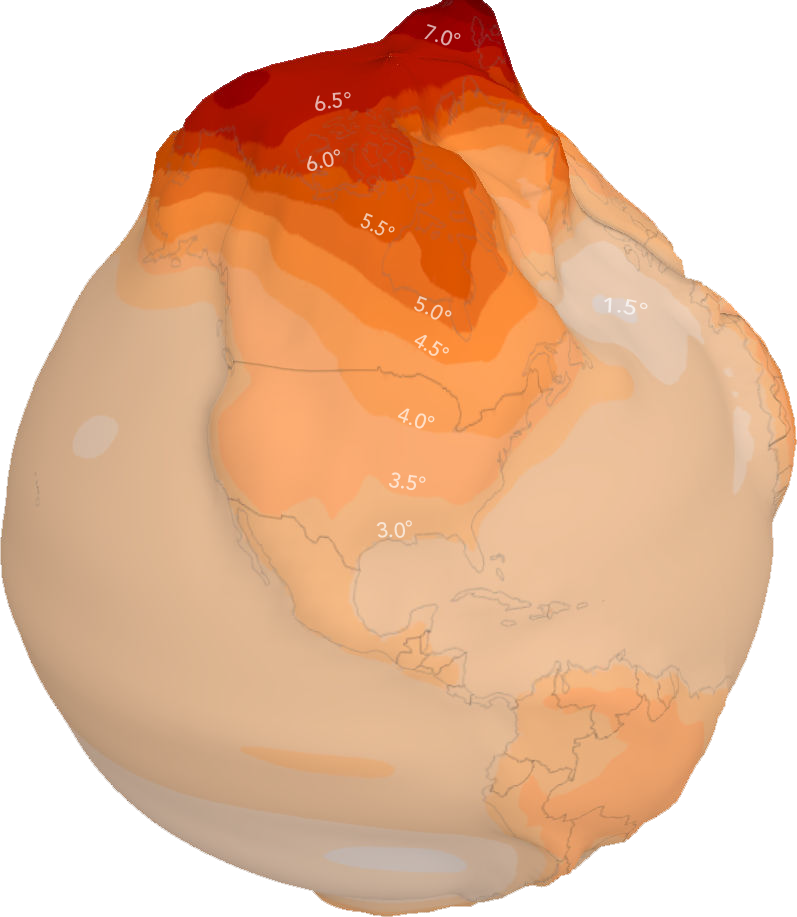
Map of Arctic warming as elevation
General Circulation Models, or GCMs, help us understand our changing climate. This map visualizes temperature change as a substitute for true elevation in a 3d map, illustrating the disproportionate effect of climate change on the Arctic using the Representative Concentration Pathways (RCP) worst-case scenario RCP8.5 (i.e. business as usual). The map represents the mean temperature difference (C °) projected temperatures for the 2040-2060 time frame (under RCP8.5) minus temperatures for the 1880-1920 time frame. The map uses data from the KNMI Climate Explorer, a web-based tool for researchers developed by the Royal Netherlands Meteorological Institute.
Attribution:
Greg Fiske / Woodwell Climate Research Center
This map can be shared in its original format only. Appropriate attribution and credit must be given.
Data sources:
KNMI Climate Explorer
Awards:
- Most Innovative Map (2021 Esri User Conference)
Go to top